
The weekly Global Equity Markets report now has a new section; TECH CHARTS STUDY. In this new section I try to answer member’s questions on different aspects of classical charting and technical analysis. Members who are new to classical charting and technical analysis will have another resource other than the educational video series to learn from and apply this knowledge to their own analysis. The latest weekly report’s Tech Charts Study section reviewed the difference between logarithmic and linear scale charting applied on Russell 2000 Index ETF (IWM [1]).
TECH CHARTS STUDY
The difference between a logarithmic price chart and an arithmetic (linear) price chart can be small when you are analyzing a chart in the short-term. However, as you look at longer-term charts (more than 2 years of price data) you will see major differences.
A linear price scale is plotted on the side of the chart so that there is an equal distance between the prices, and each unit change on the chart is represented by the same vertical distance on the scale, regardless of what price level the asset is at when the change occurs.
A logarithmic price scale is plotted so that the prices in the scale are not positioned equidistantly; instead, the scale is plotted in such a way that two equal percent changes are plotted as the same vertical distance on the scale.
How you construct your price scale will impact the trend lines you draw on your price chart. A good example is the price chart of the Russell 2000 Index ETF (IWM). The chart on the left hand side is plotted on a linear scale. The chart on the right is drawn on logarithmic scale. The upward sloping trend line broke down earlier on the logarithmic scale when compared with the trend line break on the linear scale price chart.
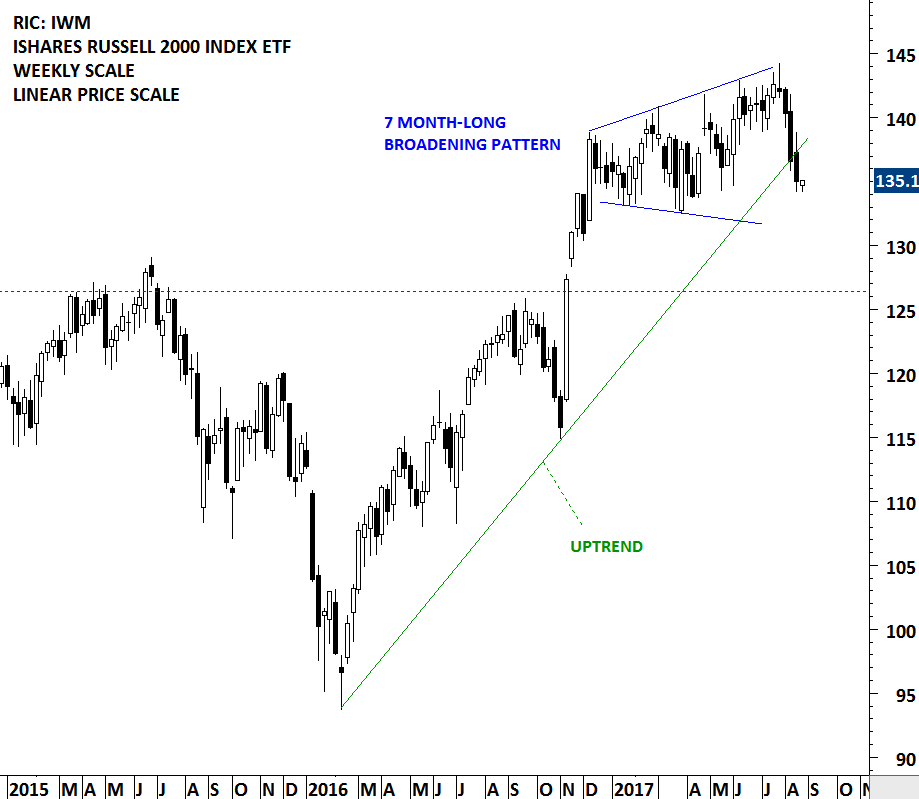
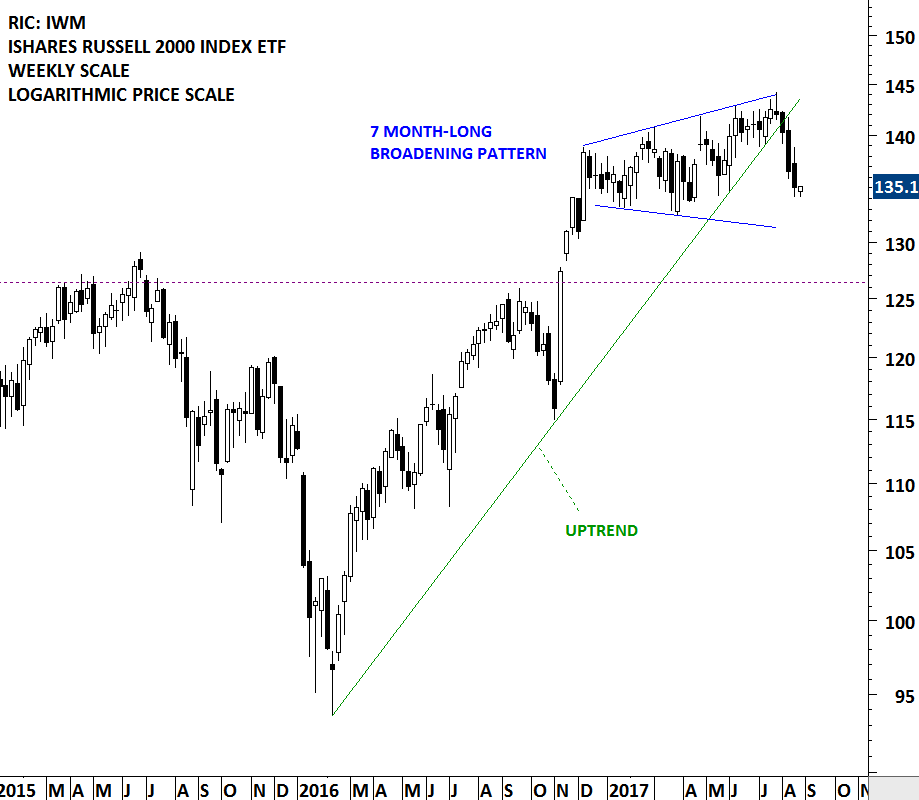
Upwards sloping logarithmic trendlines are broken sooner than similar trendlines on linear scale charts. The sell signal can be a little bit late on the linear scale.
The opposite is true for downtrends. Downwards sloping logarithmic trendlines are broken later than similar trendlines on linear scale charts. If you are planning to buy a specific instrument on the breakout of a trendline, you will be slightly late when compared with the buy signal generated on the linear scale chart.
Both have their uses and neither is superior to the other in price analysis. I find it better to use logarithmic scale when analyzing long-term charts. My default parameter for chart analysis is logarithmic scale with 5 years of data displayed as candlesticks.
Tech Charts Membership

By becoming a Premium Member, you’ll be able to improve your knowledge of the principles of classical charting.
With this knowledge, you can merge them with your investing system. In fact, some investors use my analyses to modify their existing style to invest more efficiently and successfully.
Get Access Now [2]
As a Premium Member of Aksel Kibar’s Tech Charts,
You will receive:
-
Global Equities Report. Delivered weekly.
-
Classical charting principles. Learn patterns and setups.
-
Actionable information. Worldwide indices and stocks of interest.
-
Risk management advice. The important trading points of each chart.
-
Information on breakout opportunities. Identify the ones you want to take action on.
-
Video tutorials. How patterns form and why they succeed or fail.
-
Watch list alerts. As they become available so you can act quickly.
-
Breakout alerts. Usually once a week.
-
Access to everything (now and as it becomes available)o Reports
o Videos and video series -
Multi-part webinar course. You learn the 8 most common charting principles.
-
Webinars. Actionable and timely advice on breaking out chart patterns.
For your convenience your membership auto renews each year.
Get Access Now [2]