
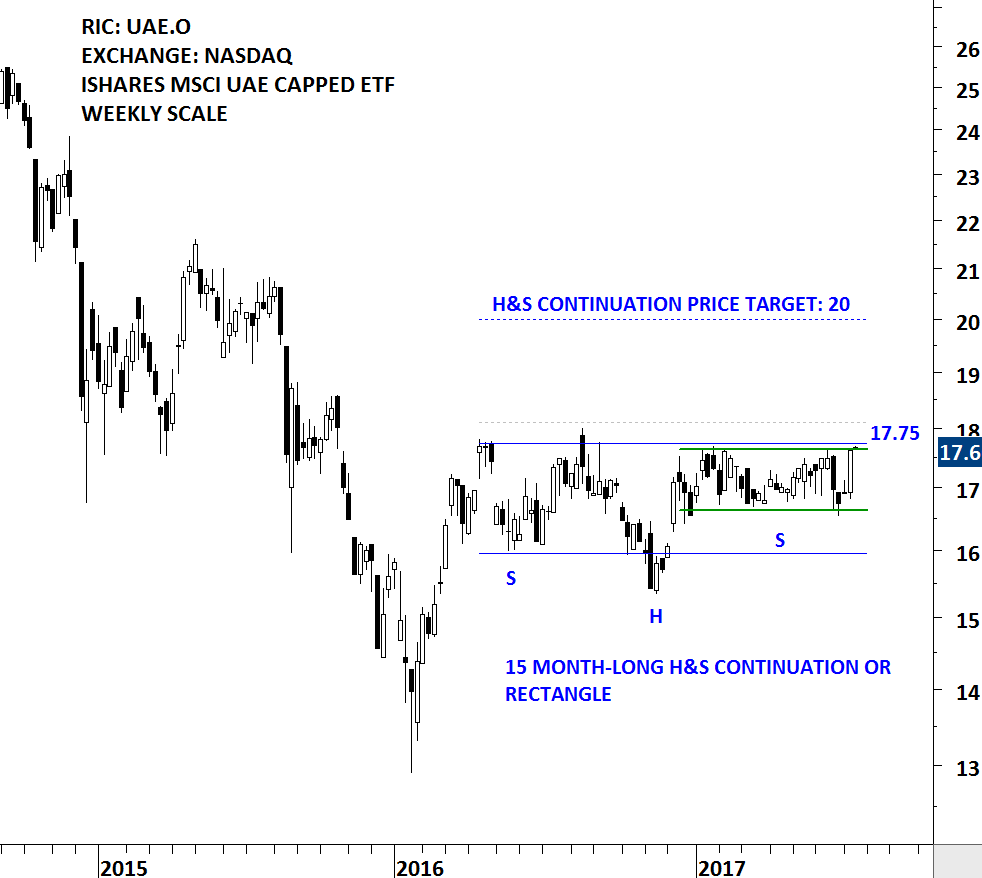
The Fund seeks to track the investment results of the MSCI All UAE Capped Index, which is designed to measure the equity market performance in the United Arab Emirates. The Fund generally invests at least 80% of its assets in securities of the underlying index or in depository receipts representing securities of the underlying index. The ETF is listed on the Nasdaq Stock Exchange. Price chart possibly formed a 15 month-long H&S continuation or a rectangle with the strong horizontal boundary standing at 17.75 levels. Last 6 month’s price action can also be identified as a rectangle; another short-term consolidation, usually acting as a preparation for a breakout. A daily close above 18.10 levels will confirm the breakout from the multi-month trading range with the chart pattern price target of 20 levels. Top 10 holdings of the iShares MSCI UAE Capped ETF is compiled in a table below. Also you can find below some examples of H&S continuation chart patterns that Tech Charts Global Equity Markets reports featured in the past issues.
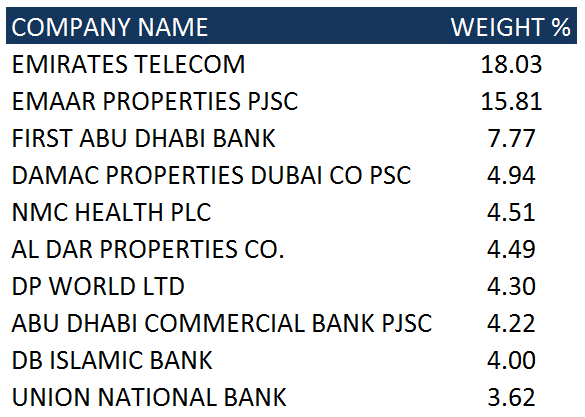
TOP 10 HOLDINGS OF ISHARES MSCI UAE CAPPED ETF (As of 17 July 2017)
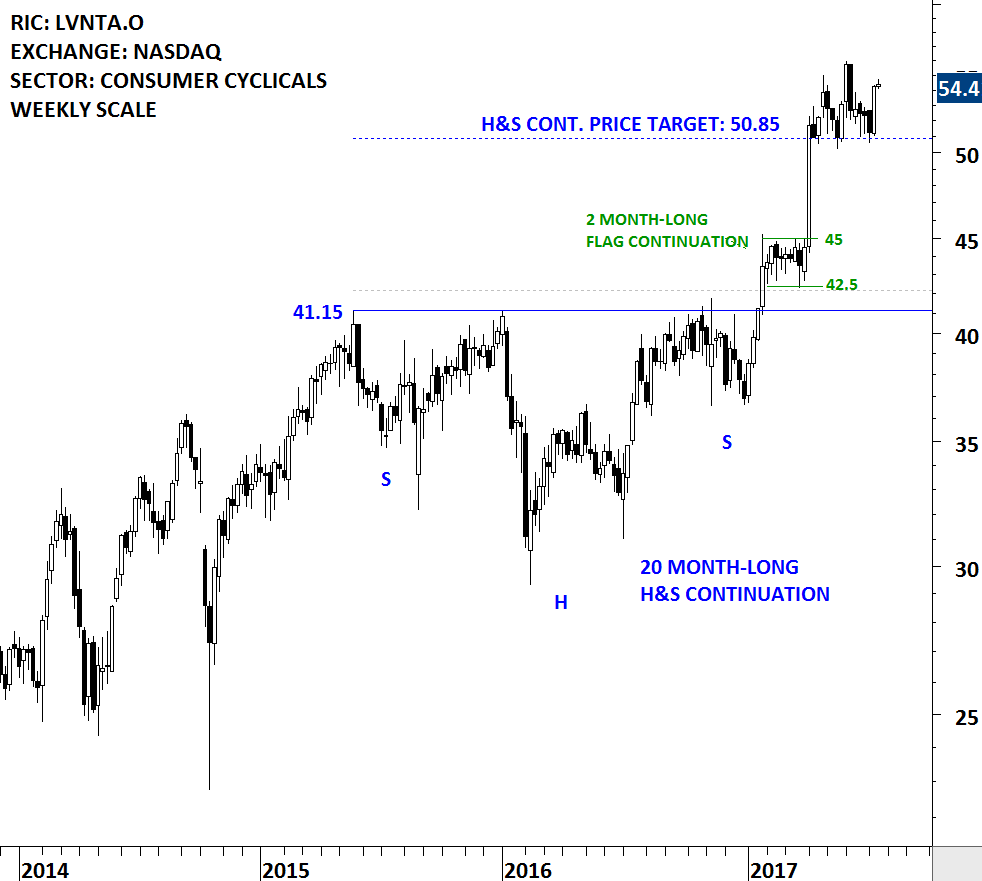
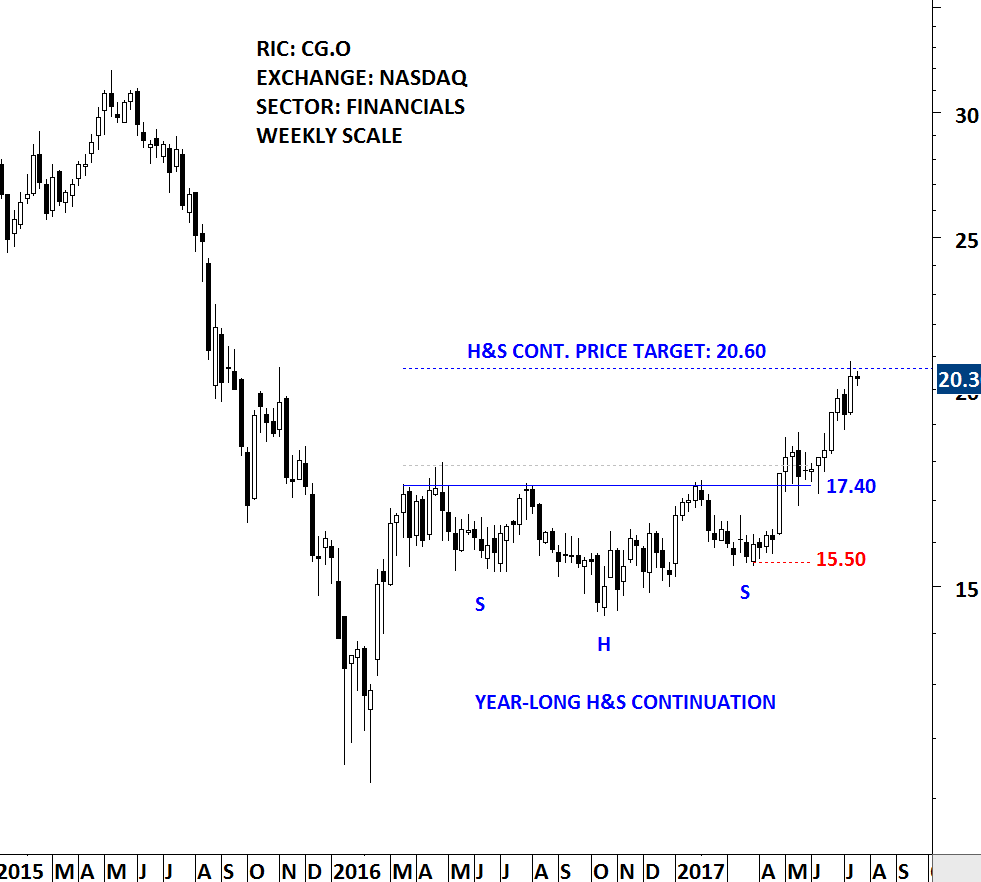
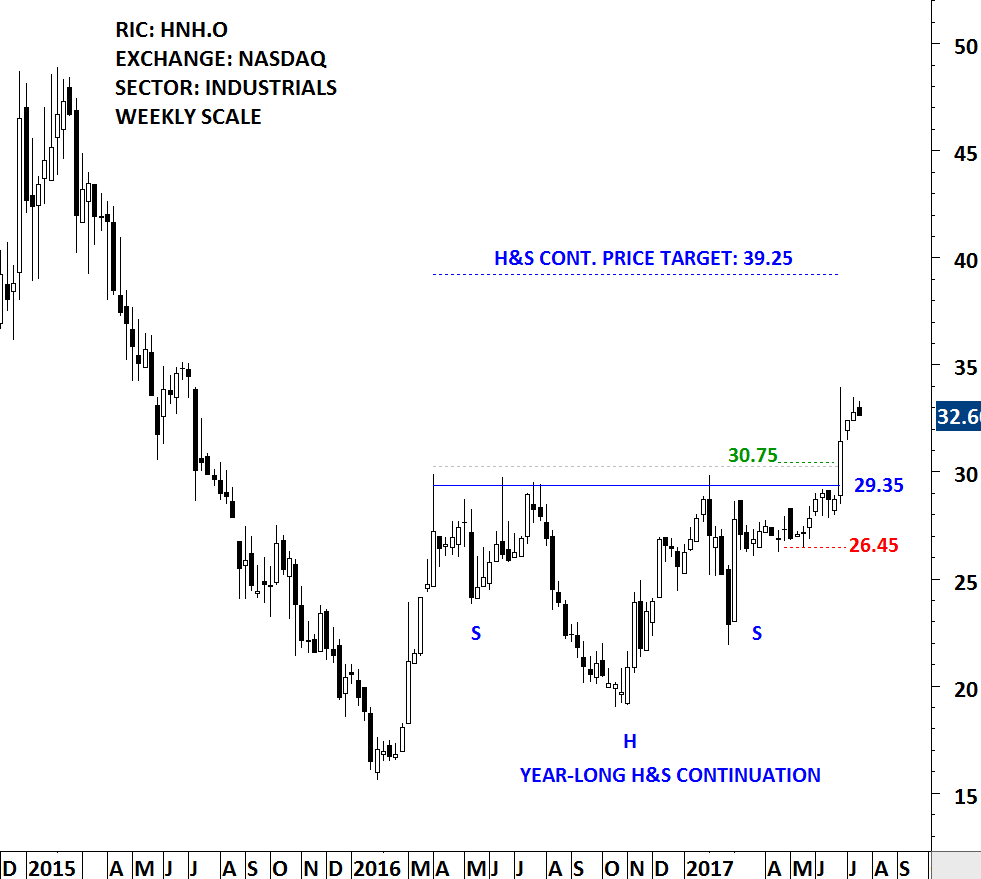
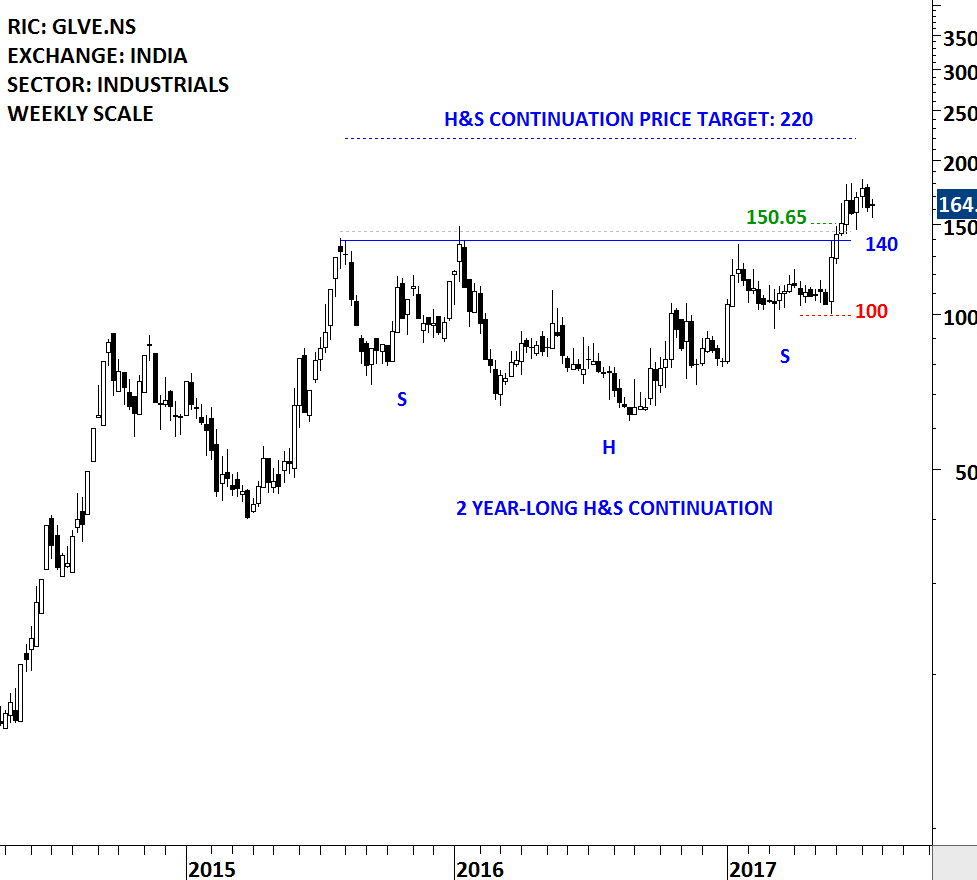
PAST EXAMPLES OF H&S CONTINUATION CHART PATTERNS TECH CHARTS FEATURED

Tech Charts Membership

By becoming a Premium Member, you’ll be able to improve your knowledge of the principles of classical charting.
With this knowledge, you can merge them with your investing system. In fact, some investors use my analyses to modify their existing style to invest more efficiently and successfully.
Get Access Now [1]
As a Premium Member of Aksel Kibar’s Tech Charts,
You will receive:
-
Global Equities Report. Delivered weekly.
-
Classical charting principles. Learn patterns and setups.
-
Actionable information. Worldwide indices and stocks of interest.
-
Risk management advice. The important trading points of each chart.
-
Information on breakout opportunities. Identify the ones you want to take action on.
-
Video tutorials. How patterns form and why they succeed or fail.
-
Watch list alerts. As they become available so you can act quickly.
-
Breakout alerts. Usually once a week.
-
Access to everything (now and as it becomes available)o Reports
o Videos and video series -
Multi-part webinar course. You learn the 8 most common charting principles.
-
Webinars. Actionable and timely advice on breaking out chart patterns.
For your convenience your membership auto renews each year.
Get Access Now [1]