
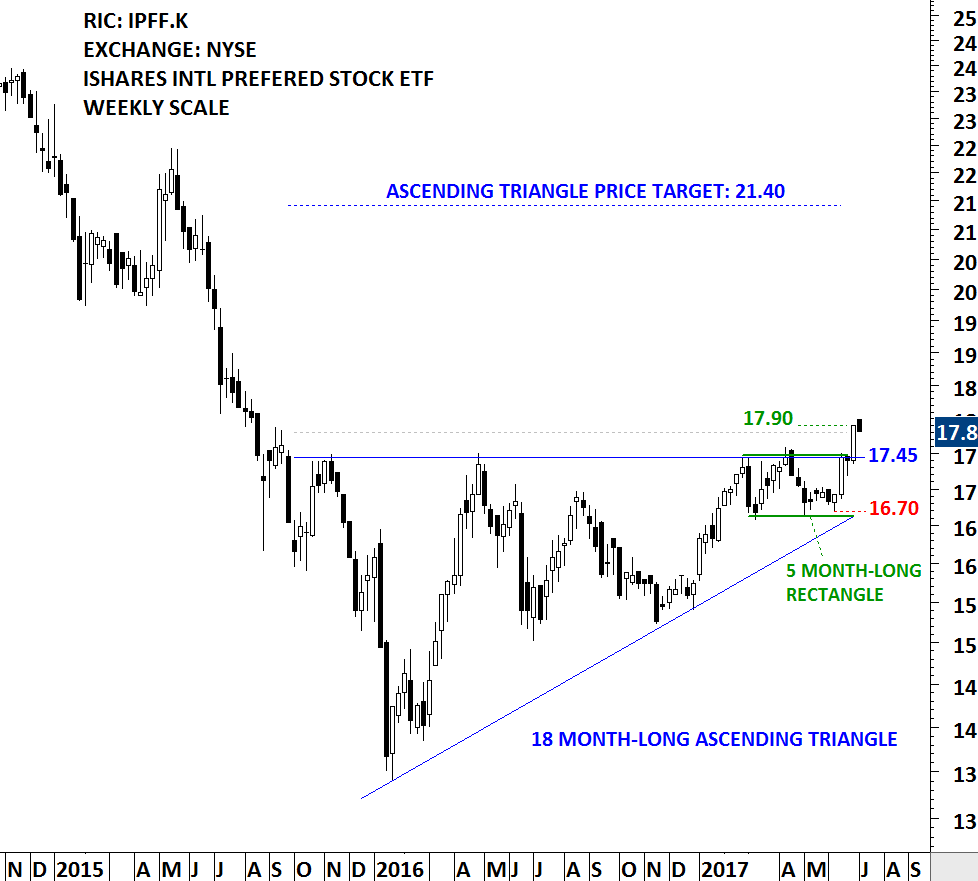
ISHARES INTL PREFERRED STOCK ETF (IPFF.K [1]) formed an 18 month-long ascending triangle. IPFF.K has a well-defined horizontal resistance that was tested several times over the course of the chart pattern. Strong horizontal boundary stands at 17.45 levels. Last 5 month’s price action can be identified as a rectangle. The 5 month-long rectangle is acting as a launching pattern (learn more about launching patterns – Video Tutorial [2]). The daily close above 17.80 levels confirmed the breakout from the multi-month ascending triangle with the possible price target of 21.40 levels.
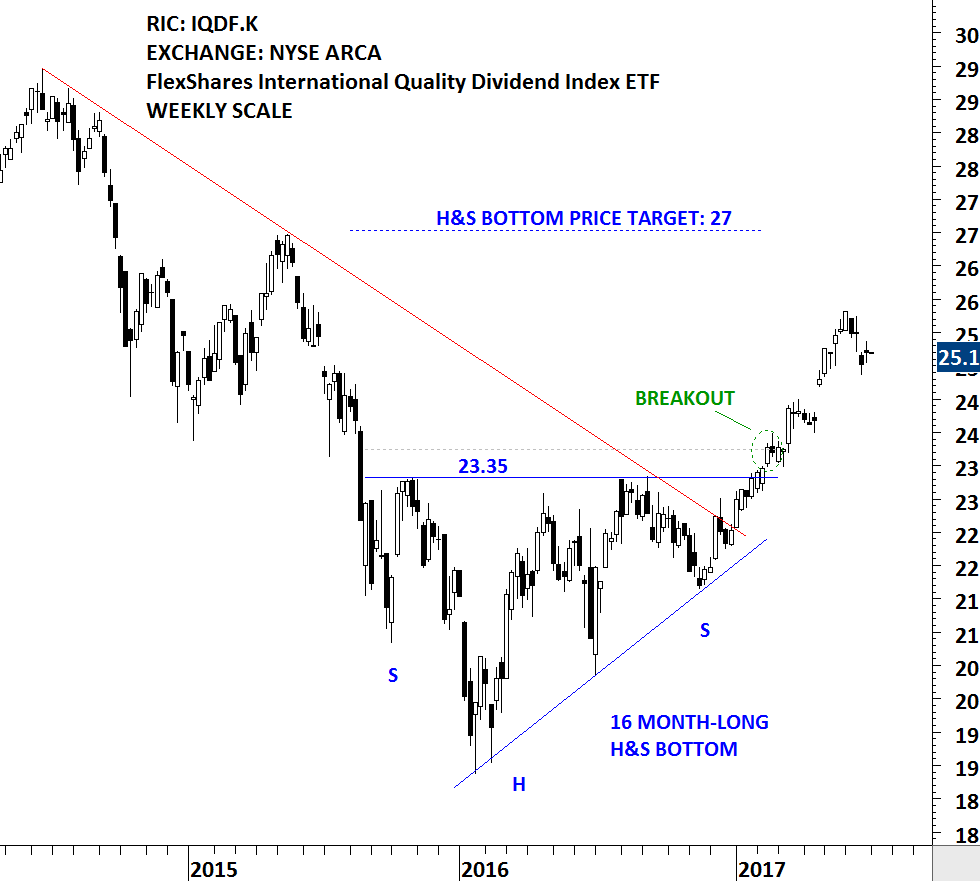
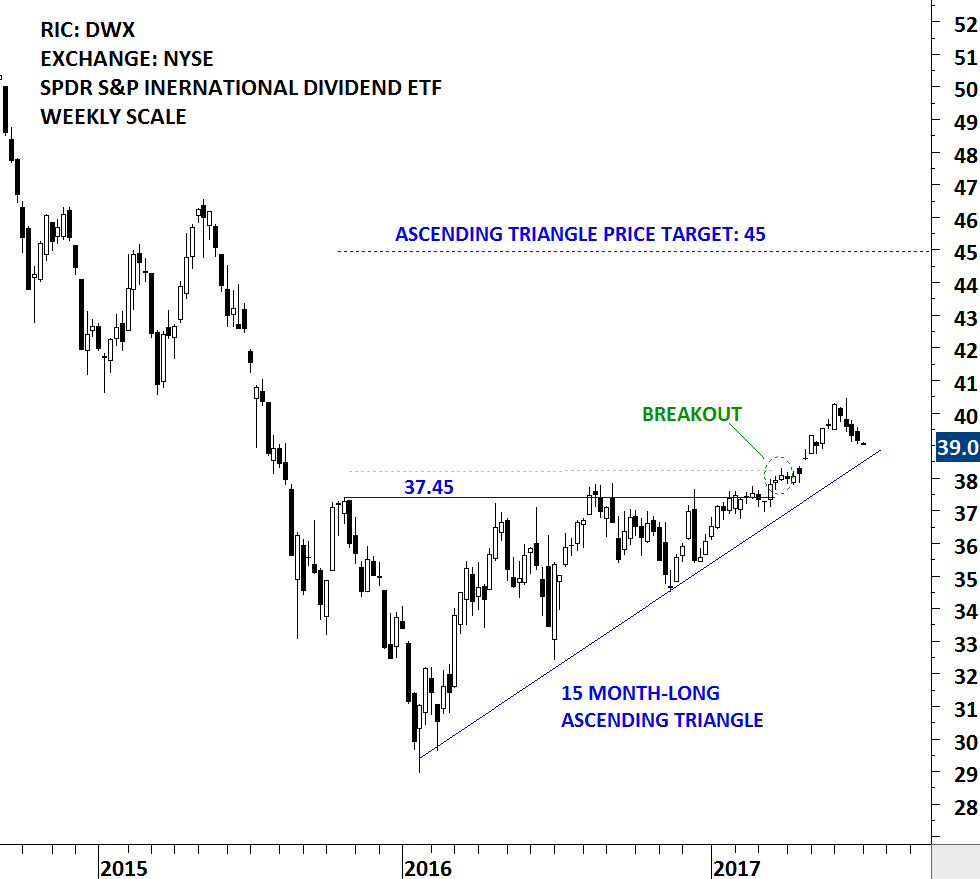
Similar chart patterns were completed on the NYSE listed ETFs. In the beginning of 2017, International Dividend ETFs had strong breakouts from major base formations. FLEXSHARES INTL QUALITY DIVIDEND INDEX ETF was the first one to break out of a 16 month-long H&S bottom. Price is still trending higher towards its possible chart pattern price target. Following IQDF.K [3], SPDR S&P INTL DIV ETF (DWX [4]) had a similar breakout from a 15 month-long ascending triangle. Both chart patterns had well-defined horizontal boundaries that were tested several times before the breakouts took place.
A new BREAKOUTS page is added to Tech Charts Website to track all chart pattern breakout alerts
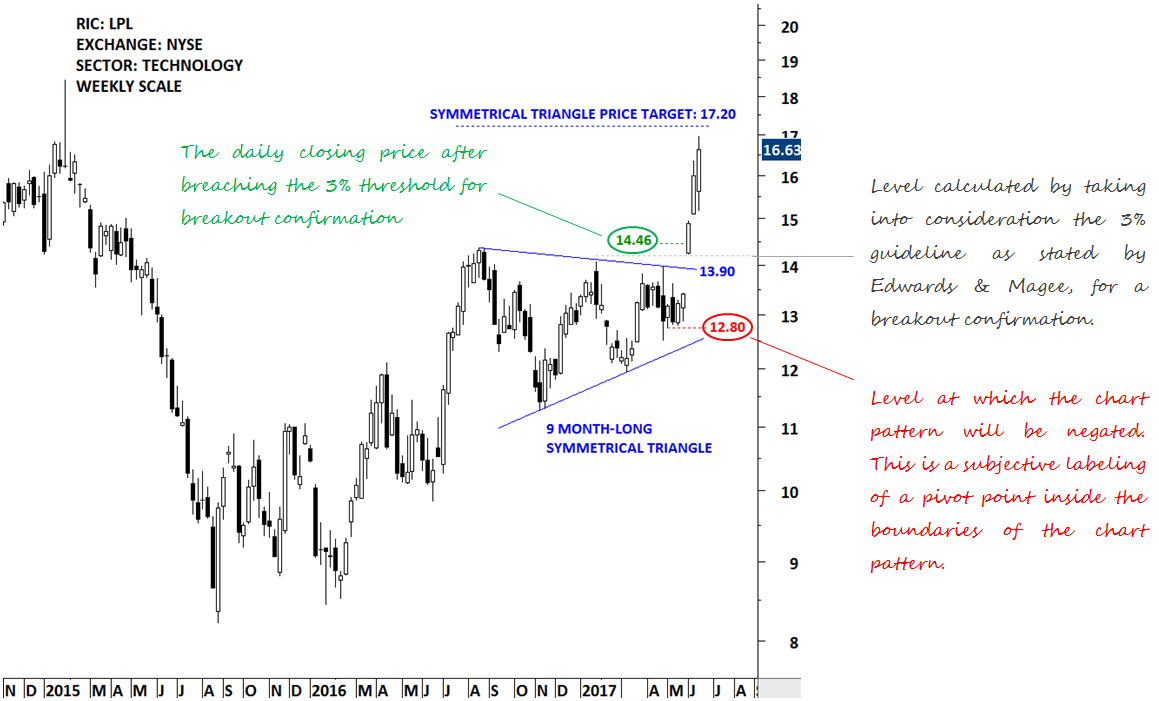
Tech Charts takes into consideration the breakout guideline as stated by Edwards & Magee in their book Technical Analysis of Stock Trends. A daily close by 3% margin above the chart pattern boundary is required for a chart pattern breakout confirmation.
Tech Charts Membership

By becoming a Premium Member, you’ll be able to improve your knowledge of the principles of classical charting.
With this knowledge, you can merge them with your investing system. In fact, some investors use my analyses to modify their existing style to invest more efficiently and successfully.
Get Access Now [5]
As a Premium Member of Aksel Kibar’s Tech Charts,
You will receive:
-
Global Equities Report. Delivered weekly.
-
Classical charting principles. Learn patterns and setups.
-
Actionable information. Worldwide indices and stocks of interest.
-
Risk management advice. The important trading points of each chart.
-
Information on breakout opportunities. Identify the ones you want to take action on.
-
Video tutorials. How patterns form and why they succeed or fail.
-
Watch list alerts. As they become available so you can act quickly.
-
Breakout alerts. Usually once a week.
-
Access to everything (now and as it becomes available)o Reports
o Videos and video series -
Multi-part webinar course. You learn the 8 most common charting principles.
-
Webinars. Actionable and timely advice on breaking out chart patterns.
For your convenience your membership auto renews each year.
Get Access Now [5]