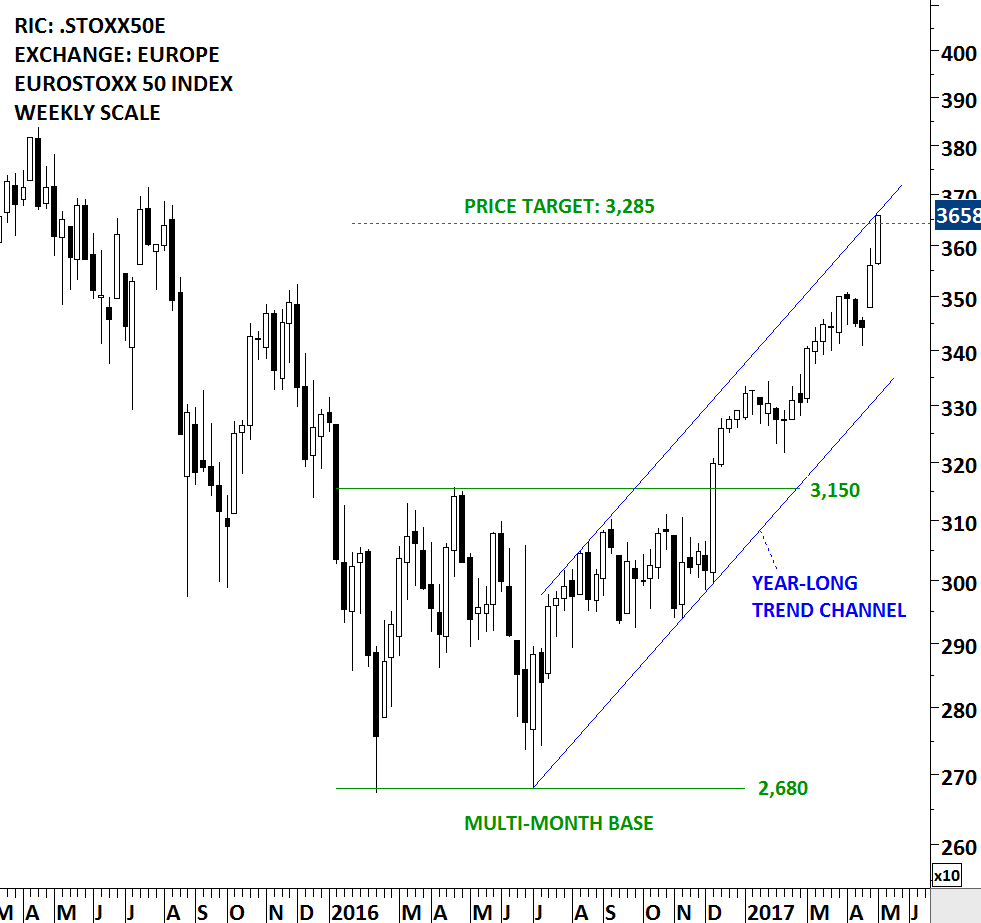
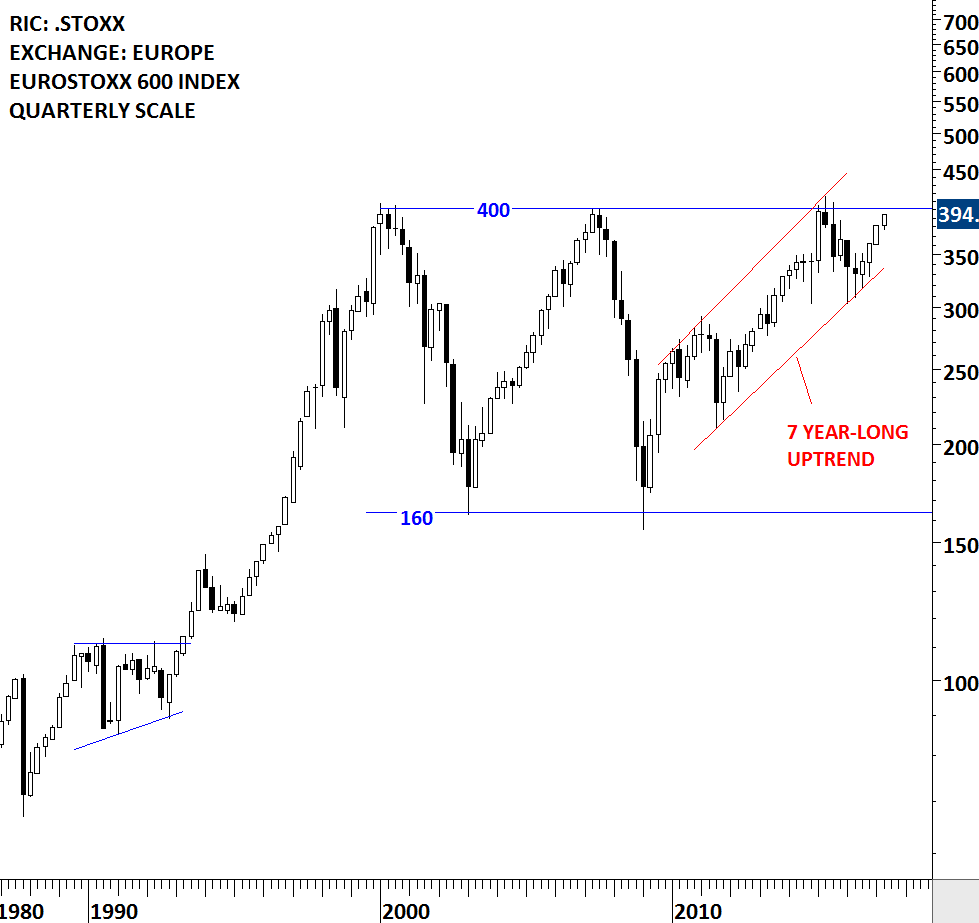
All eyes will be on the French election this weekend. The two candidates will face off in the second round on May 7. European equities have been strong since the first round election results. Two benchmark indices on Euro Stoxx 50 and Euro Stoxx 600 can put the European equity performance into perspective. Both charts show that uptrends have been intact for some time. Euro Stoxx 50 index broke out of its multi-month base in December 2016 and now very close to reaching its possible price target around 3,285 levels. The price target for the Euro Stoxx 50 Index is calculated by taking the width of the multi-month consolidation and adding it to the breakout point. 3,285-3,300 area is also the upper boundary of the parallel trend channel. On the other hand Euro Stoxx 600 Index is very close to its multi-year strong horizontal resistance at 400 levels. Both indices will face strong technical resistance in the following trading days/weeks. Performance around these strong technical resistance will shed more light on the long-term direction of the European equity performance.
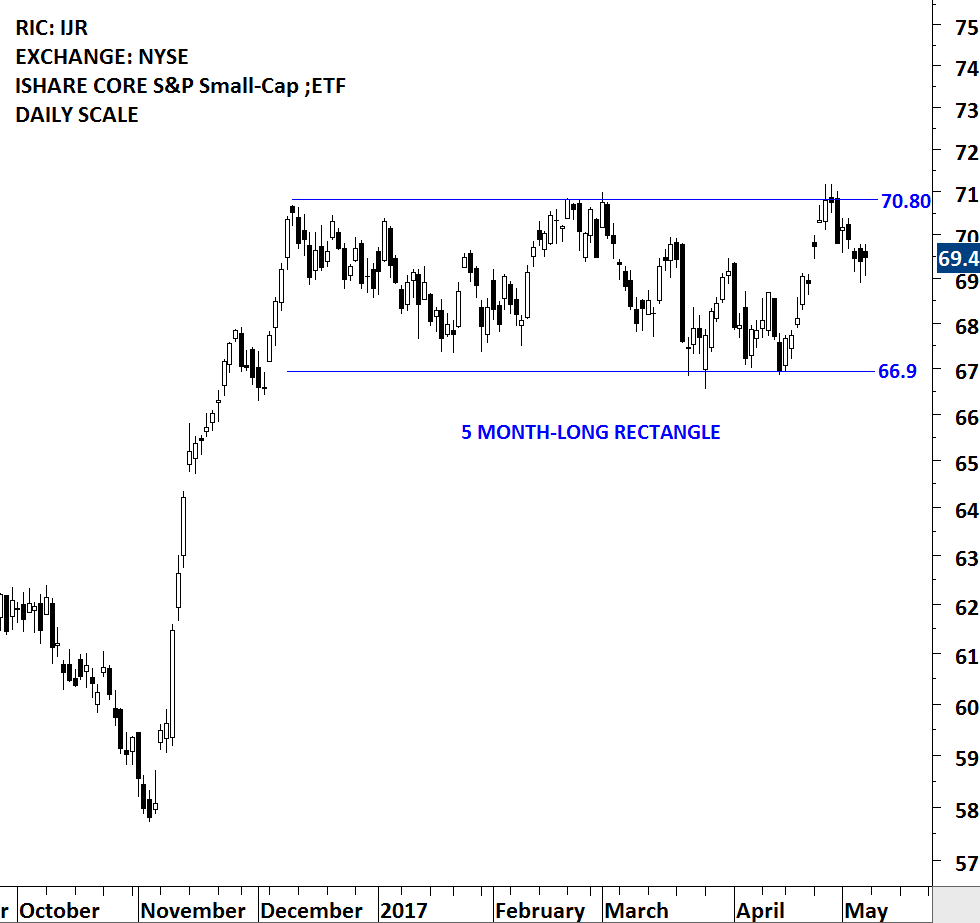
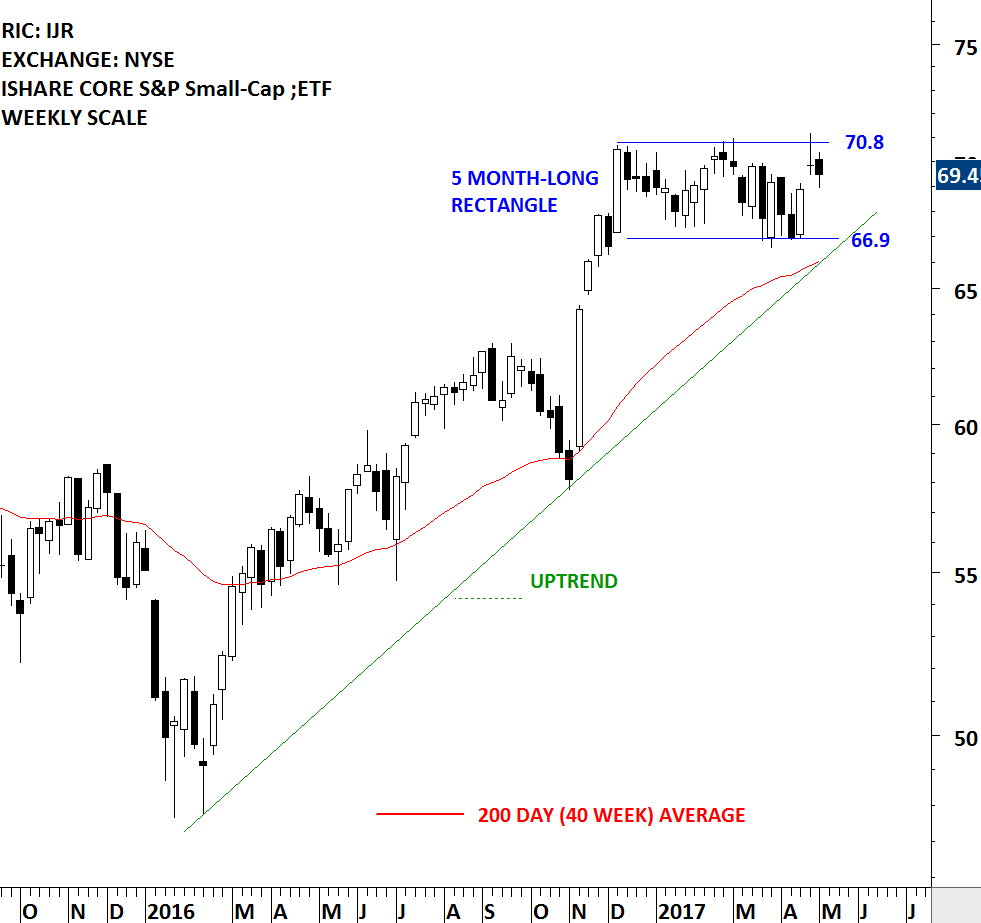
While European equities such as Euro Stoxx 600 index is reaching strong long-term resistance, small-caps in the U.S. are preparing for another directional move. Small caps have been in a trading range over the past 5 months. ISHARES CORE S&P SMALL-CAP 600 INDEX ETF (IJR) is forming a 5 month-long rectangle chart pattern that can act as a continuation and resume the uptrend. Since the beginning of 2016 price has been in a steady uptrend. The upper boundary of the 5 month-long rectangle stands as strong resistance at 70.80 levels. Breakout above 70.80 will be positive for the small cap ETF.
There are 8 new chart pattern breakout signals during this week
#TECHCHARTSALERT [1]
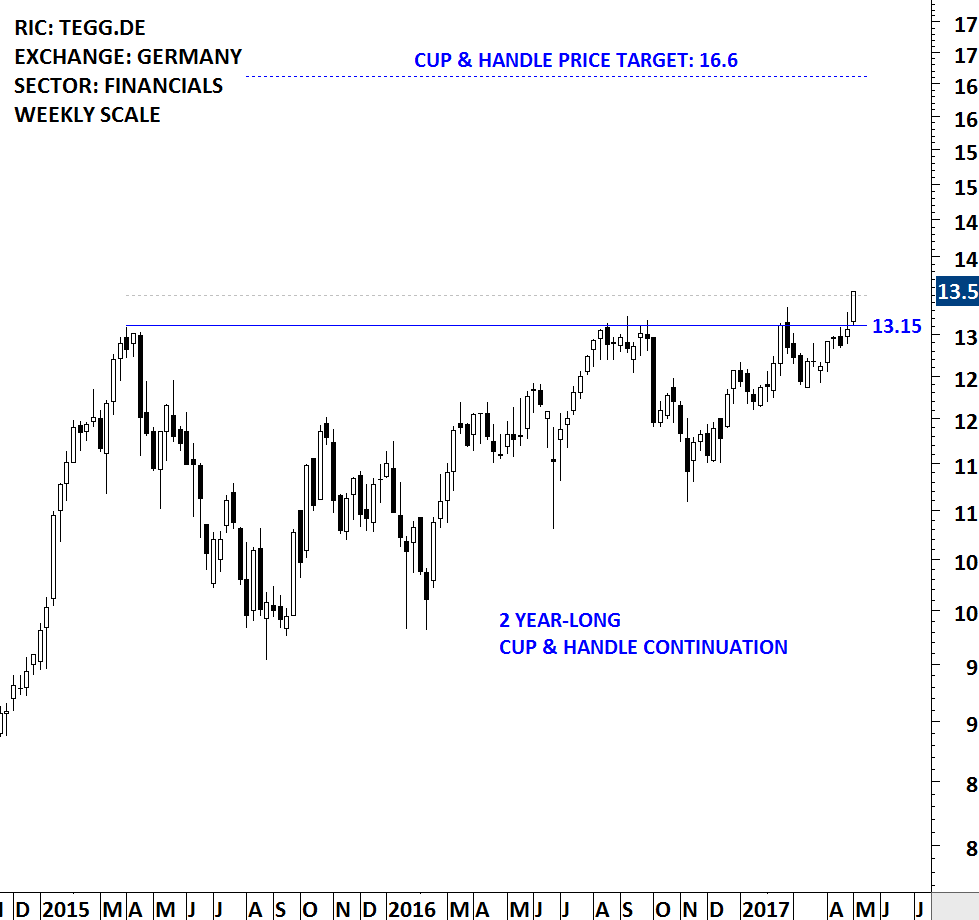
TAG IMMOBILIEN AG (TEGG.DE [2])
TAG Immobilien AG is a Germany-based real estate company that focuses on the acquisition, development and management of residential real estate. The geographical focus is on northern and eastern Germany, such as the metropolitan areas of Hamburg and Berlin, as well as on the Salzgitter and Thuringia/Saxony regions and North Rhine-Westphalia. The stock is listed on Germany XETRA. Price chart formed a 2 year-long cup & handle bullish continuation chart pattern with multi-year horizontal resistance standing at 13.15 levels. The daily close above 13.50 levels confirmed the breakout from the lengthy consolidation. Cup & handle possible chart pattern price target stands at 16.60 levels.
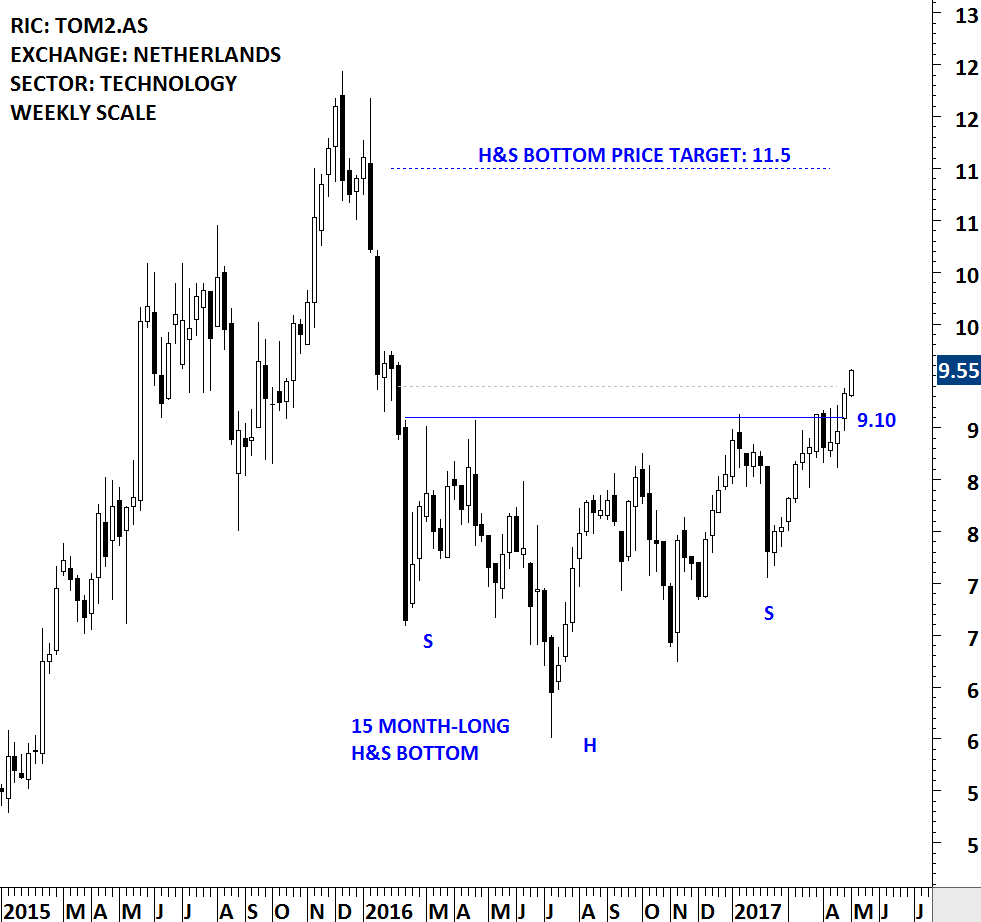
TOMTOM NV (TOM2.AS [3])
TomTom NV is a supplier of navigation systems, fleet management solutions and other related products that is based in the Netherlands. The stock is listed on the Amsterdam Stock Exchange. Price chart formed a 15 month-long H&S bottom with the strong horizontal resistance standing at 9.10 levels. The horizontal boundary has been tested for 4 times over the course of the chart pattern development. The daily close above 9.40 levels confirmed the breakout from the multi-month bullish reversal chart pattern with a possible price target of 11.5 levels.
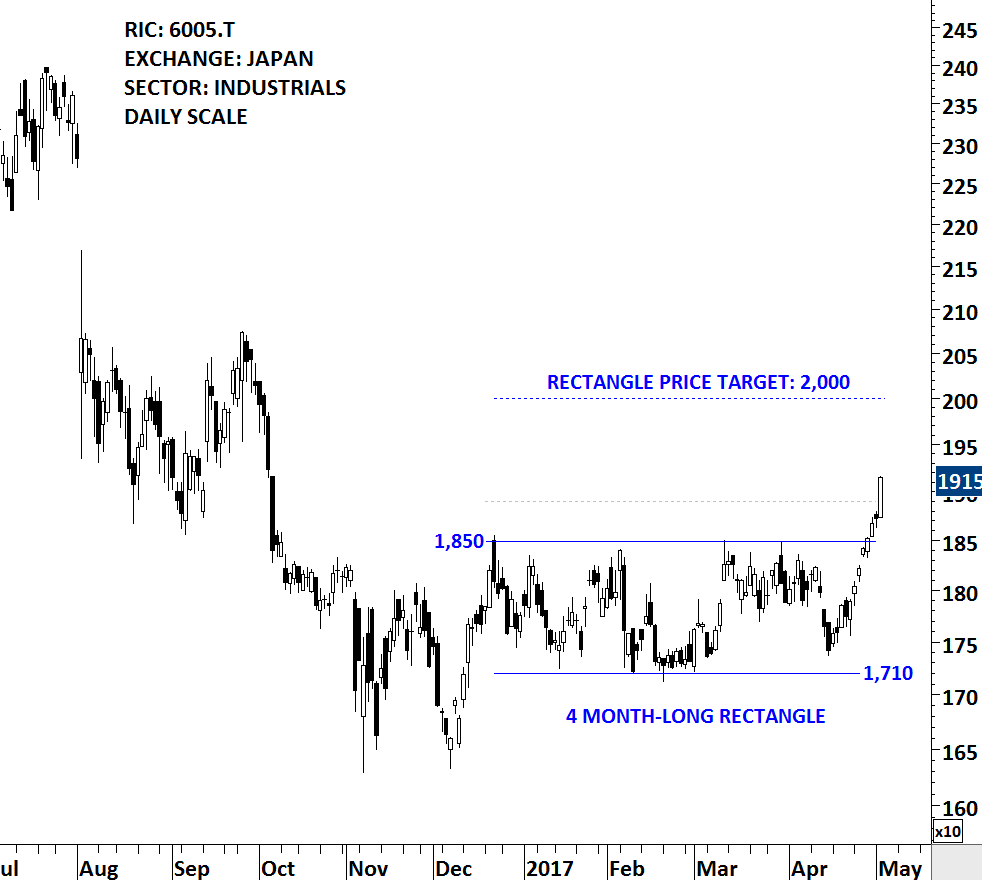
MIURA CO LTD. (6005.T [4])
MIURA CO., LTD. is a Japan-based company engaged in the manufacturing of boilers. The stock is listed on the Tokyo Stock Exchange. Price chart formed a 4 month-long rectangle with the strong horizontal boundary standing at 1,850 levels. The rectangle is possibly acting as a reversal chart pattern. The daily close above 1,890 confirmed the breakout with a possible price target of 2,000 levels. MIURA CO was discussed under Tech Chart watchlist on April 29th Global Equity Market report
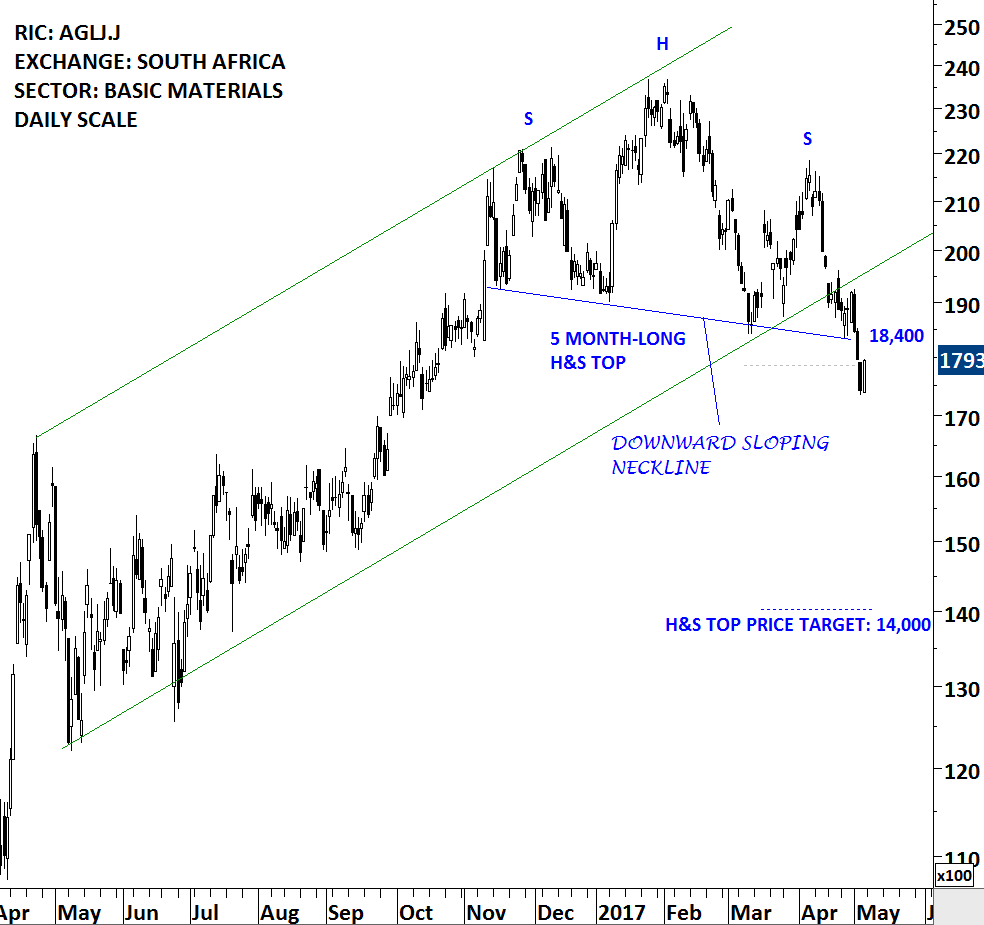
ANGLO AMERICAN PLC (AGLJ.J [5])
Anglo American plc is a mining company. The Company has a portfolio of mining operations and undeveloped resources with a focus on diamonds, copper, platinum group metals (PGMs), and bulk commodities and other minerals. Its segments include De Beers, Platinum, Copper, Nickel, Niobium and Phosphates, Iron Ore and Manganese, Coal, and Corporate and other. The stock is listed on London Stock Exchange and also Johannesburg Stock Exchange. Price chart below shows the Johannesburg Stock Exchange listing. The stock formed a 5 month-long H&S top with a downward sloping neckline. H&S tops with downward sloping necklines are more bearish compared to H&S tops with horizontal or upward sloping necklines. 18,400 levels was the neckline for the H&S top. The daily close below 17,850 levels confirmed the breakdown with a possible price target of 14,000 levels.
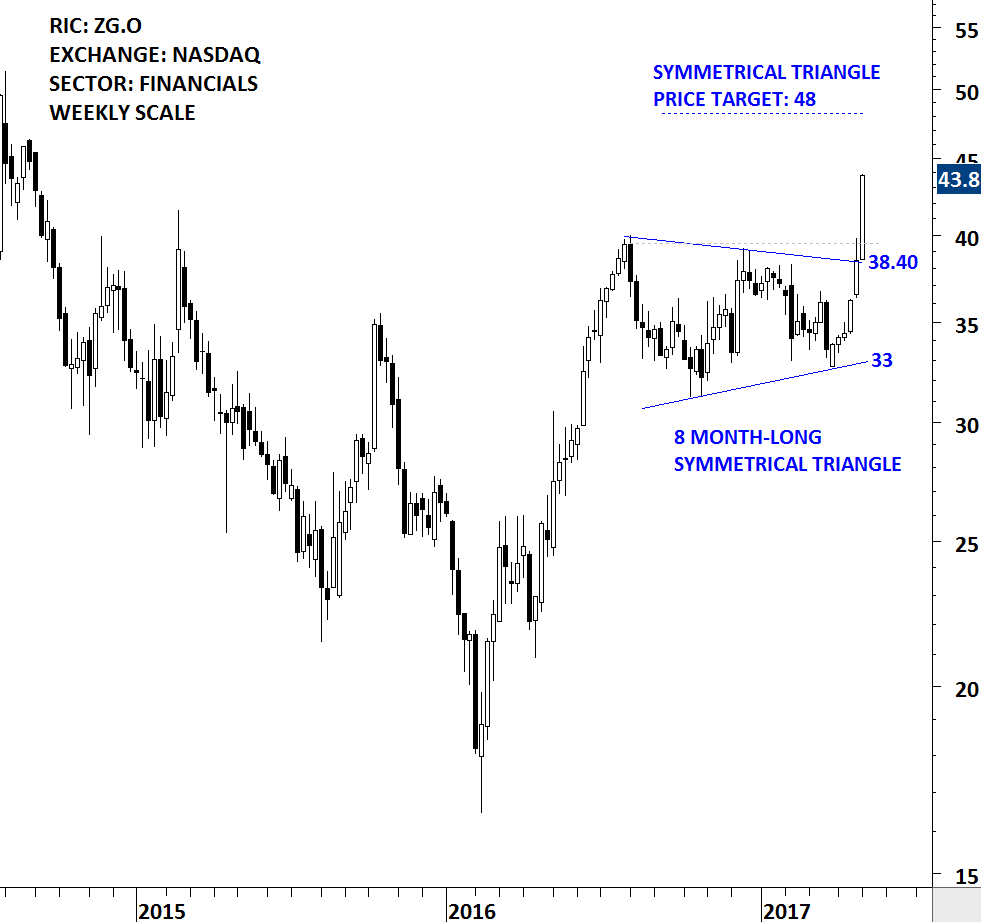
ZILLOW GROUP (ZG.O [6])
Zillow Group, Inc. operates real estate and home-related information marketplaces on mobile and the Web, with a portfolio of brands and products to enable people find vital information about homes and connect with local professionals. The stock is listed on the Nasdaq Stock Exhange. Price chart formed an 8 month-long symmetrical triangle. The daily close above 39.50 confirmed the breakout with a possible price target of 48 levels. Zillow Group was discussed under Tech Chart watchlist on April 29th Global Equity Market report.
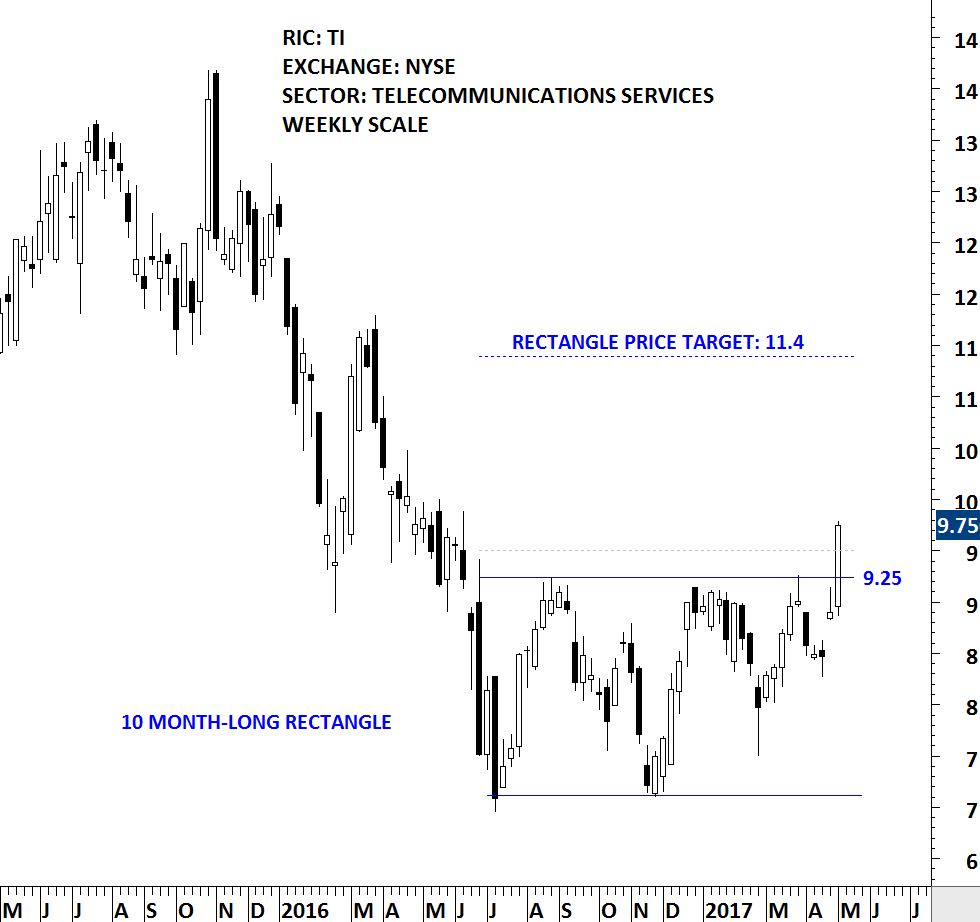
TELECOM ITALIA (TI [7])
Telecom Italia S.p.A. (Telecom Italia) operates fixed voice and data infrastructure in Italy, and provides mobile network platforms. The Company focuses on various areas of digital services, including Enriched Communication, Trusted Digital Life, Business Life, Indoor Life, Mobile Open Life and Digital Entertainment. The stock is listed on Milan Stock Exchange as well as New York Stock Exchange. The chart below shows the New York Stock Exchange listing. Price chart formed a 10 month-long rectangle with the strong horizontal boundary standing at 9.25 levels. Rectangles can act as reversal chart pattern with after long trends. The daily close above 9.50 levels confirmed the breakout from the lengthy consolidation with a possible price target of 11.4 levels.
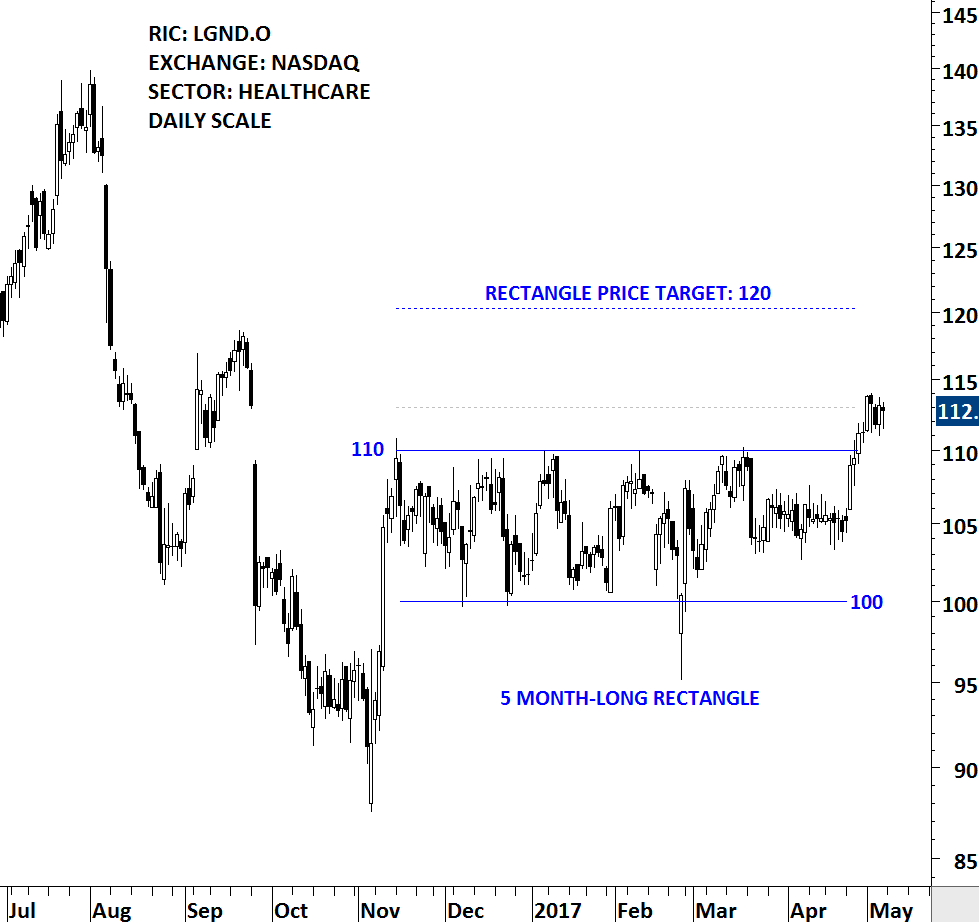
LIGAND PHARMACEUTICALS (LGND.O [8])
Ligand Pharmaceuticals Incorporated (Ligand) is a biopharmaceutical company that focuses on developing and acquiring technologies that help pharmaceutical companies discover and develop medicines. The Company is involved in the development and licensing of biopharmaceutical assets. The stock is listed on the Nasdaq Stock Exchange. Price chart formed a 5 month-long rectangle. The upper boundary of the rectangle stands at 110 levels. The horizontal boundary was tested several times over the course of the chart pattern. The daily close above 113 levels confirmed the breakout with a possible price target of 120. It is important to note that after breakouts from lengthy & narrow sideways consolidations price can exceed the predetermined chart pattern price target. LIGAND PHARMA was discussed under Tech Chart watchlist on April 29th Global Equity Market report
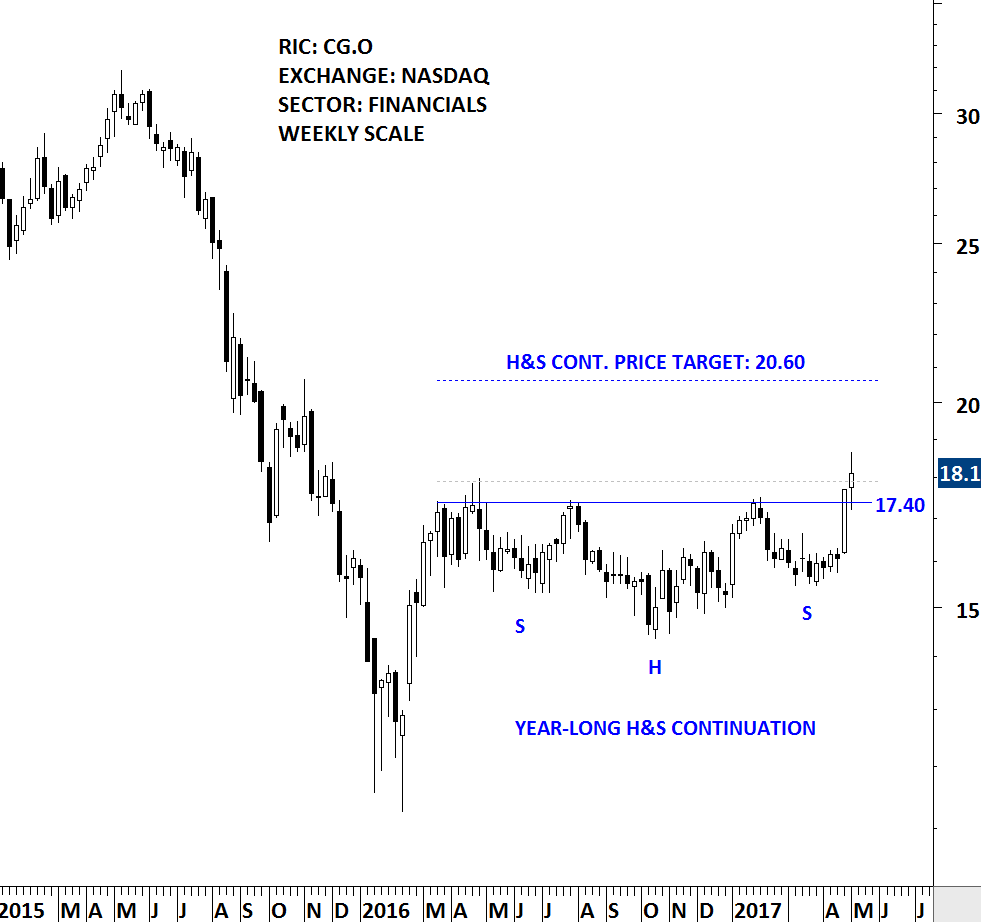
CARLYLE GROUP LP (CG.O [9])
The Carlyle Group L.P. is a diversified multi-product global alternative asset management firm. The Company operates in four segments: Corporate Private Equity (CPE), Real Assets, Global Market Strategies (GMS) and Investment Solutions. The stock is listed on the Nasdaq Stock Exchange. Price chart formed a year-long H&S continuation with the strong horizontal boundary standing at 17.40 levels. The daily close above 17.90 levels confirmed the breakout from the multi-month bullish continuation chart pattern with a possible price target of 20.60 levels.
There are 6 additions to the TECH CHARTS WATCHLIST
#TECHCHARTSWATCHLIST [10]
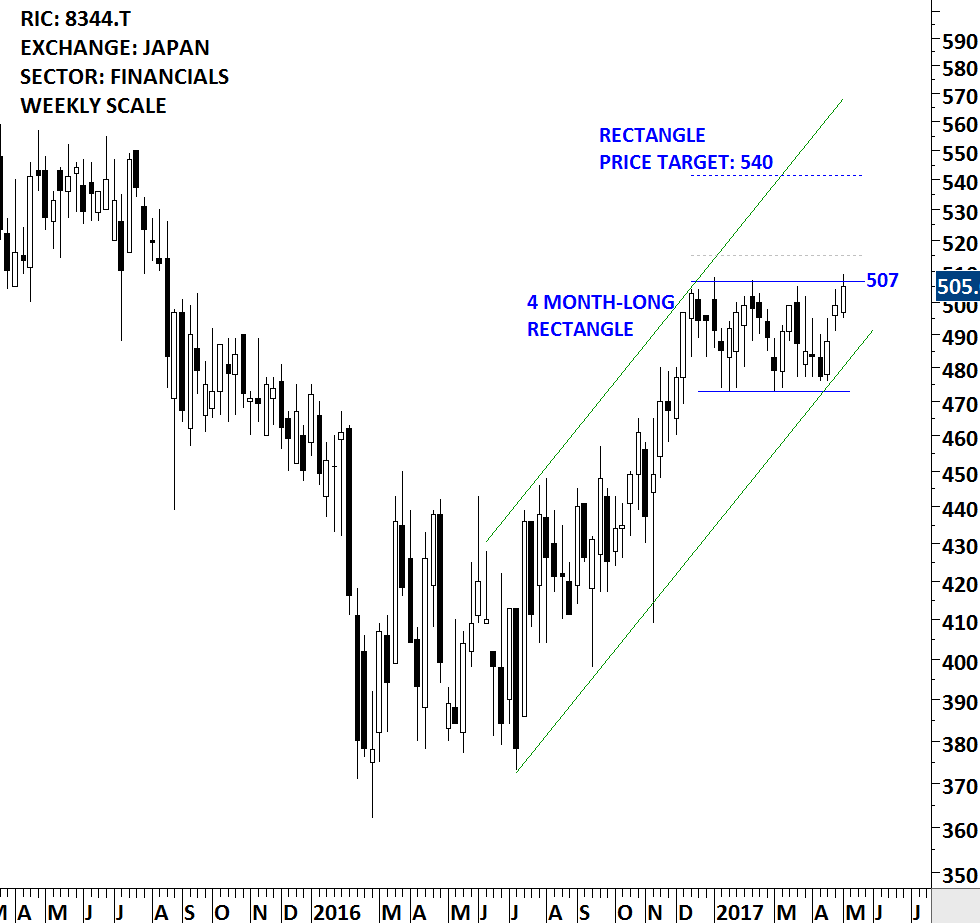
YAMAGATA BANK (8344.T [11])
The Yamagata Bank, Ltd. is a regional bank. The Bank provides banking services, leasing services and other services. The stock is listed on the Tokyo Stock Exchange. Price chart formed a 4 month-long rectangle with the upper boundary standing as resistance at 507 levels. Rectangle in an uptrend is usually a continuation chart pattern. Stock price has been in a consistent uptrend with high weekly volatility. Possible chart pattern price target stands at 540 levels.
HITACHI TRANSPORT SYSTEM (9086.T [12])
Hitachi Transport System, Ltd. is engaged in the provision of general logistics services. The Domestic Logistics segment is involved in the operation of domestic system logistics business, the transportation and installation of general cargos, dead weights and art works, the transfer of factories and business offices, the provision of warehousing services, as well as the collection and transportation of industrial waste. The International Logistics segment conducts the global system logistics business, the overseas logistics and air transportation agency businesses. The stock is listed on the Tokyo Stock Exchange. Price chart formed a 4 month-long ascending triangle with the strong horizontal resistance standing at 2,450 levels. A daily close above 2,520 levels will confirm the breakout from the bullish continuation chart pattern with the possible price target of 2,760 levels.
![]()
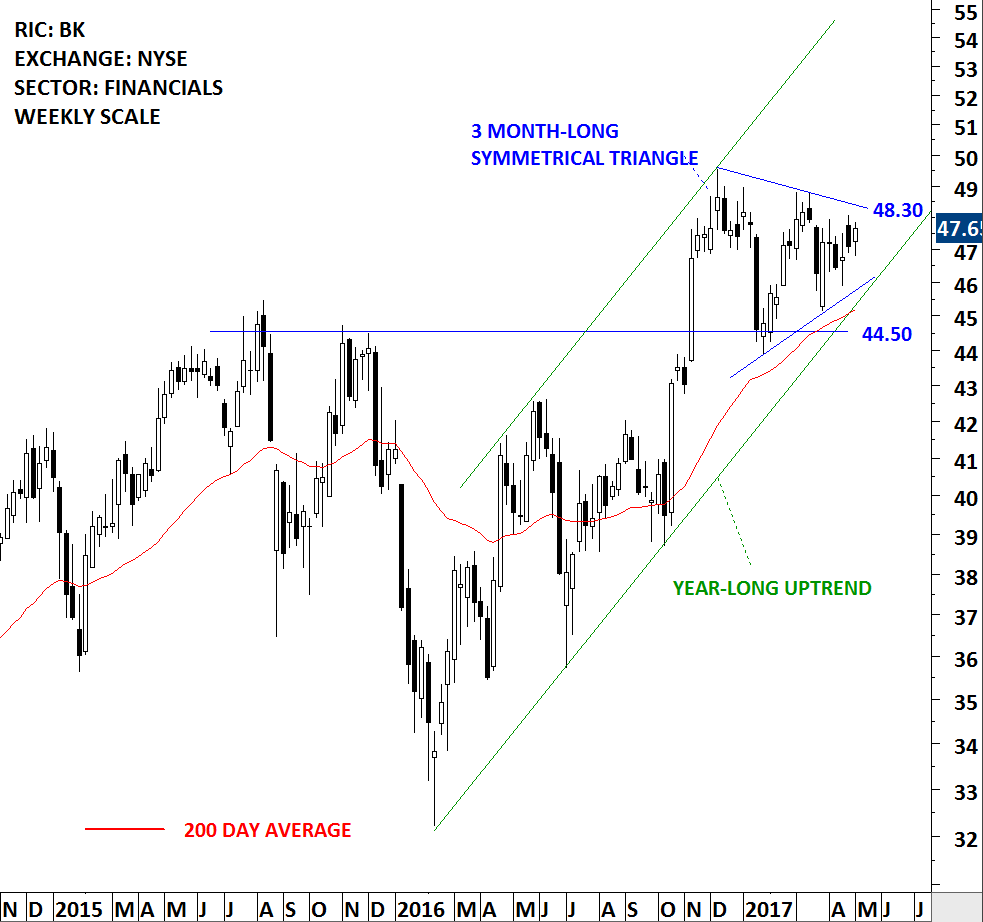
BANK OF NEW YORK MELLON CORP (BK [13])
The Bank of New York Mellon Corporation is an investments company. The Company operates businesses through two segments: Investment Management and Investment Services. The stock is listed on the New York Stock Exchange. Price chart formed a 3 month-long symmetrical triangle that can act as a continuation chart pattern. The upper boundary of the consolidation is resistance at 48.3 levels. Last 3 month’s consolidation is taking place above strong horizontal support at 44.50. Breakout above 48.30 levels will resume the uptrend. Both the year-long trend channel and the 200 day (40 week) average suggest that the stock is in a steady uptrend.
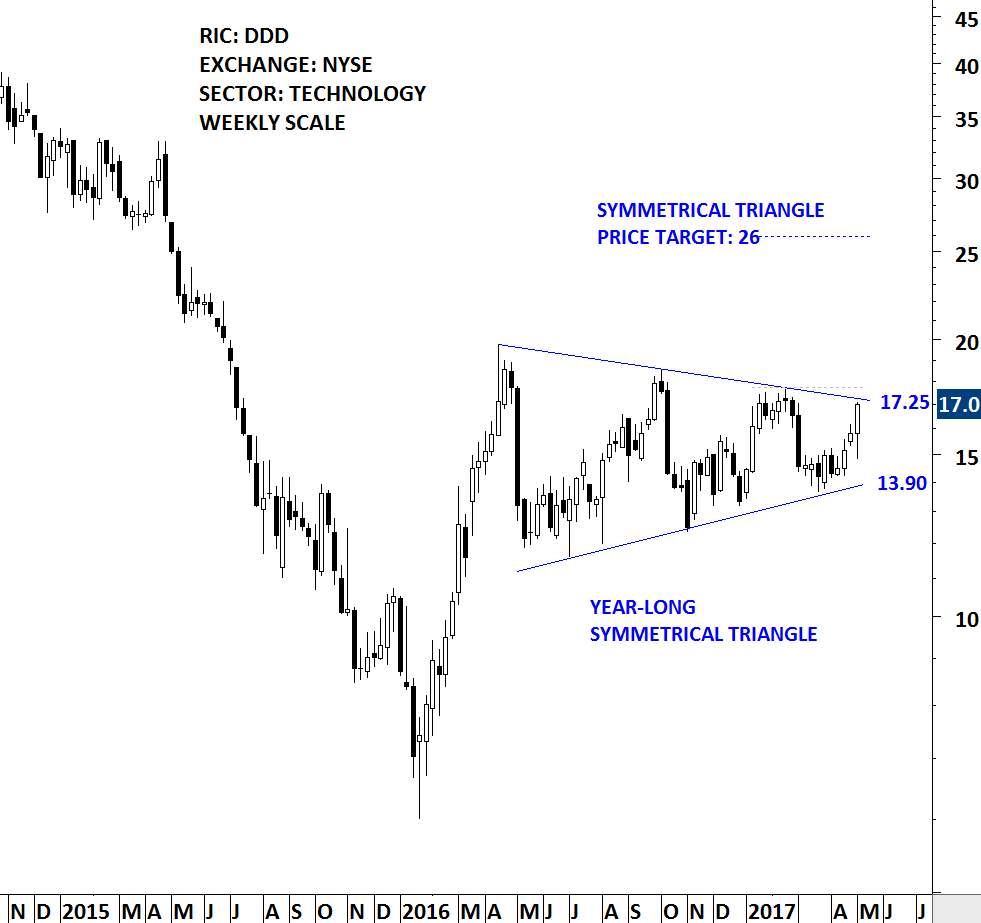
3D SYSTEMS CORP. (DDD [14])
3D Systems Corporation is a holding company. The Company provides three-dimensional (3D) printing solutions, including 3D printers, print materials, software, on demand manufacturing services and digital design tools. Its precision healthcare capabilities include simulation, Virtual Surgical Planning (VSP), and printing of medical and dental devices and surgical guides and instruments. Its solutions support applications in a range of industries, including healthcare, aerospace, automotive and durable goods. The stock is listed on the New York Stock Exchange. Price chart formed a year-long symmetrical triangle with the upper boundary standing at 17.25 levels. The symmetrical triangle can act as a continuation chart pattern. A daily close above 17.75 levels will confirm the breakout from the lengthy sideways consolidation with a possible price target of 26 levels.
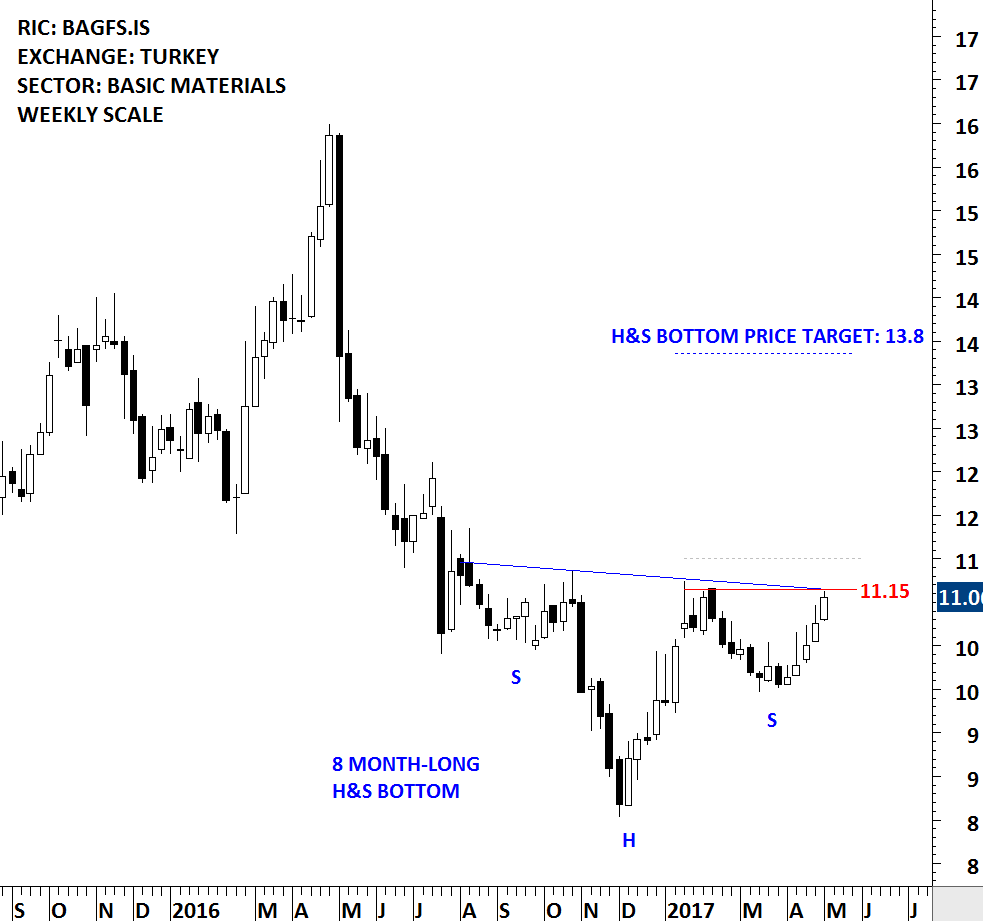
BAGFAS GUBRE FABRIKALARI AS (BAGFS.IS [15])
Bagfas Bandirma Gubre Fabrikalari AS (Bagfas) is a Turkey-based company engaged in the manufacture, import and export of chemical fertilizers and acids. The stock is listed on the Istanbul Stock Exchange. Price chart formed an 8 month-long H&S bottom with a downward sloping neckline. Bagfas can clear both the minor high at 11.15 and the neckline of the H&S bottom. Edwards and Magee in their book Technical Analysis of Stock Trends suggest that a stock should breakout or breakdown by a min 3% margin above or below the resistance/support (on a daily closing basis) for a clear chart pattern breakout signal. A daily close above 11.50 will confirm the breakout from the multi-month chart pattern with a possible price target of 13.8.
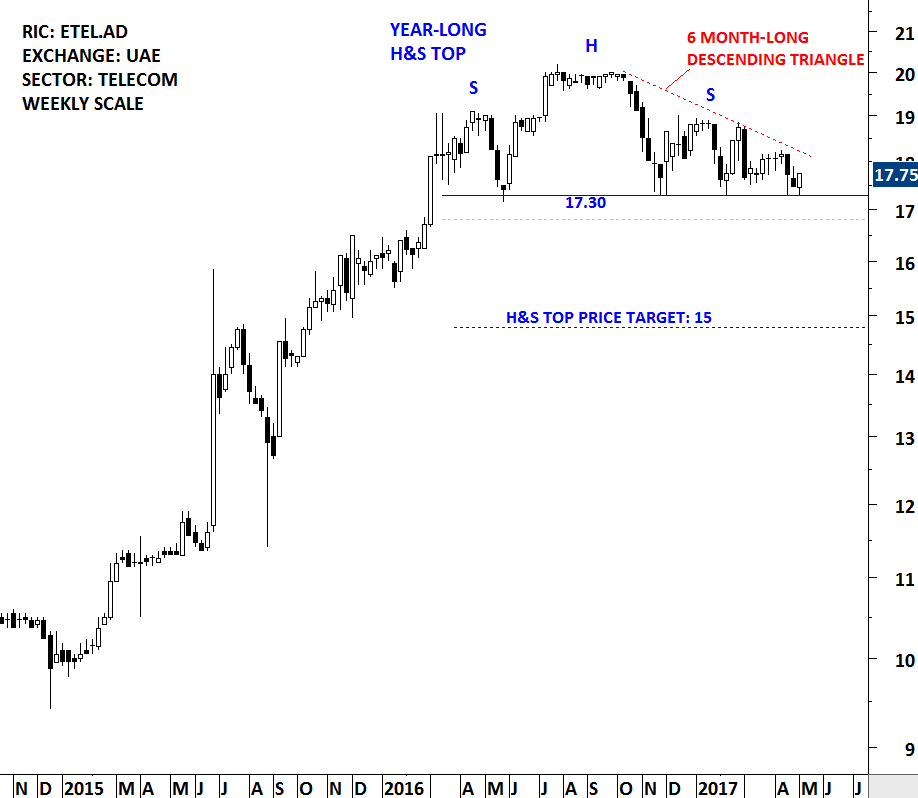
EMIRATES TELECOMMUNICATIONS (ETEL.AD)
Emirates Telecommunications Group Co PJSC, formerly Emirates Telecommunications Corporation, is a United Arab Emirates-based company engaged in the provision of telecommunications services, media and related equipment, as well as related contracting and consultancy services. The stock is listed on the Abu Dhabi Stock Exchange. Price formed a year-long H&S top with the right shoulder in the form of a 6 month-long descending triangle. Breakdown of the descending triangle and the H&S top can take place at the same price level. Both chart patterns are bearish developments. A daily close below 16.80 levels will confirm the breakdown with a possible price target of 15.