A relatively short but eventful trading week is behind us. Volatility increased due to geopolitical tensions. Equity indices came under pressure with bonds moving higher. There were 4 new chart pattern breakout signals during the week. Irrespective of general market direction, I try to feature those breakouts and breakdowns from well-defined trading ranges as they develop.
#TECHCHARTSALERT
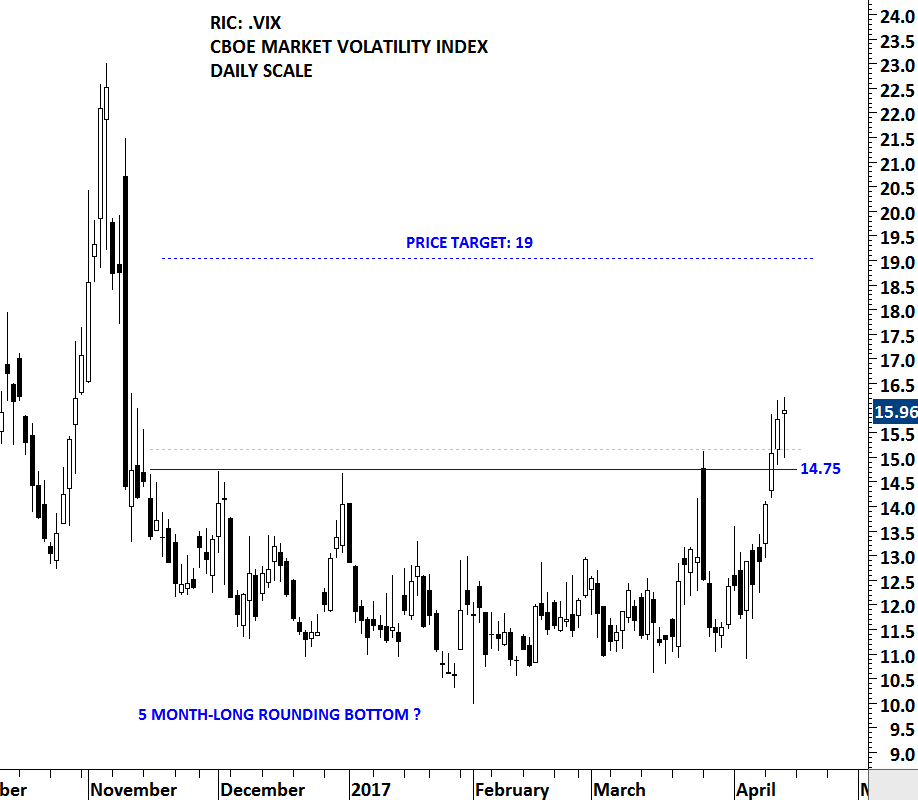
CBOE VOLATILITY INDEX (VIX)
Over the past 5 months, the VIX consolidated between 10 and 15 levels. Price tested the horizontal resistance at 14.75 for 3 times over the course of the 5 month-long consolidation. Since the beginning of April, volatility index has been inching higher towards the strong resistance. The daily close above 15.15 levels completed the 5 month-long consolidation. Our focus is now on two important levels. First one is 14.75, that will act as support during any possible pullback. Failure to hold above 14.75 will put the interpretation of higher levels into question. Second one is the chart pattern price target at 19 levels. Price target is calculated by taking the width of the 5 month-long consolidation and adding it to the breakout level.
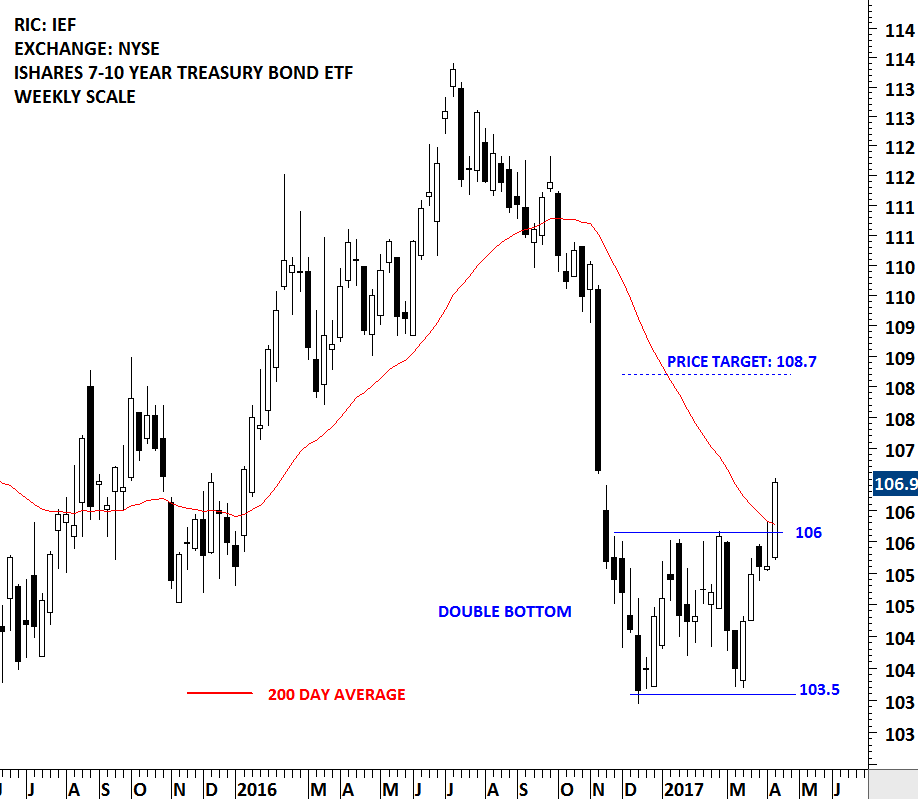
ISHARES 7-10 YEAR TREASURY BOND ETF (IEF [1])
While this chart pattern is shorter in duration than what I usually feature on weekly scale (4 months-24 months long chart patterns), it is a theme that needs to be discussed in this weekly update. Breakout from the double bottom suggests higher bond prices in the coming weeks. Equity traders will find several bond ETFs that are listed on the U.S. stock exchanges. The one I posted on twitter during the week is the ISHARES 7-10 YEAR TREASURY BOND ETF. Last week’s bearish candlestick was reversed by this week’s long white candlestick. Breakout above 106 levels also pushed the price above the 200 day average, another bullish technical development. Chart pattern price target stands at 108.7 levels.
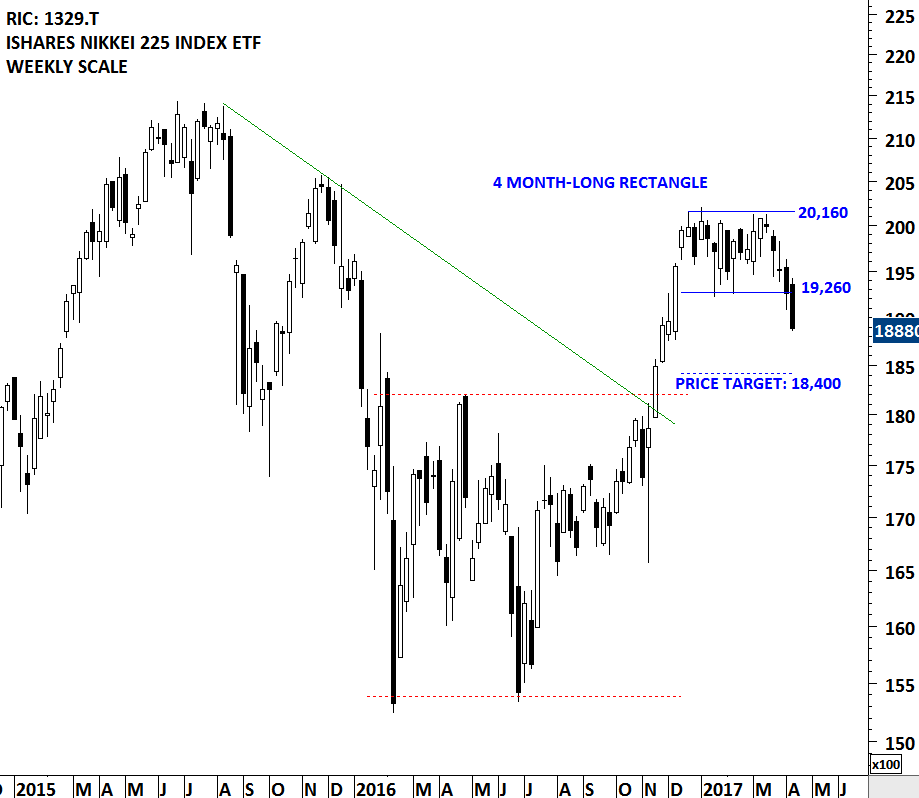
ISHARES NIKKEI 225 INDEX ETF (1329.T [2])
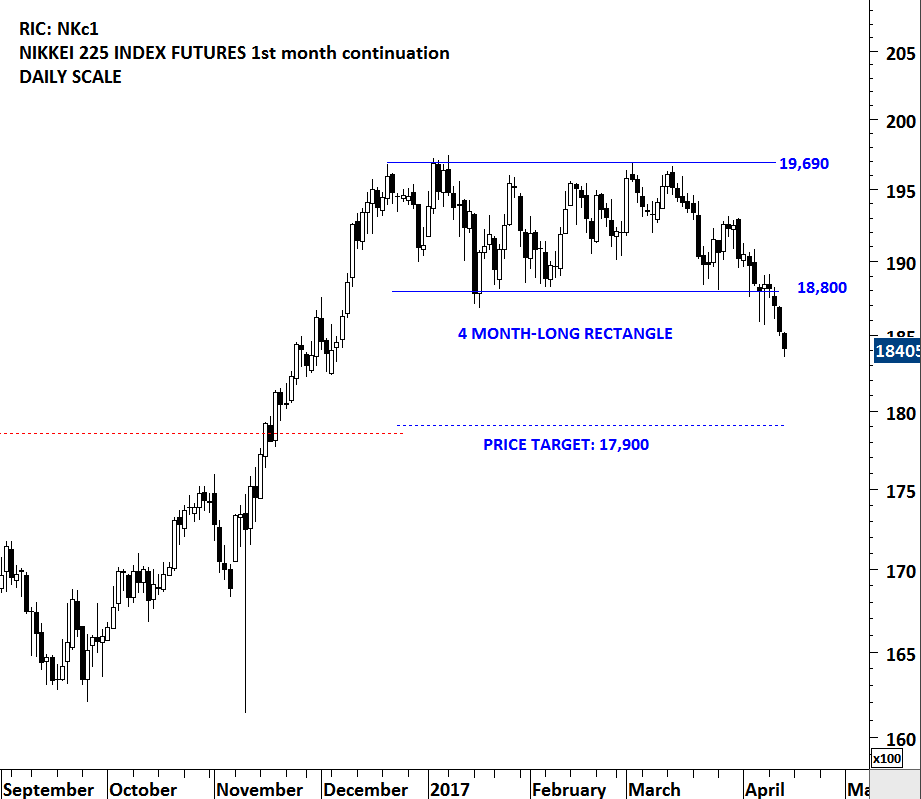
There are times when a rectangle can act as a reversal chart pattern. The breakdown below the lower boundary at 18,800 completed the chart pattern as a rectangle reversal with a possible price target of 17,900 on the NIKKEI 225 Index futures and 18,400 on the ISHARES NIKKEI 225 INDEX ETF, listed on the Tokyo Stock Exchange. Last week’s bullish reversal candlesticks around the lower boundary of the rectangle was reversed by this week’s long black weekly candle. 19,260 levels becomes the new resistance on the ISAHRES NIKKEI 225 INDEX ETF.
SAIZERIYA CO (7581.T [3])
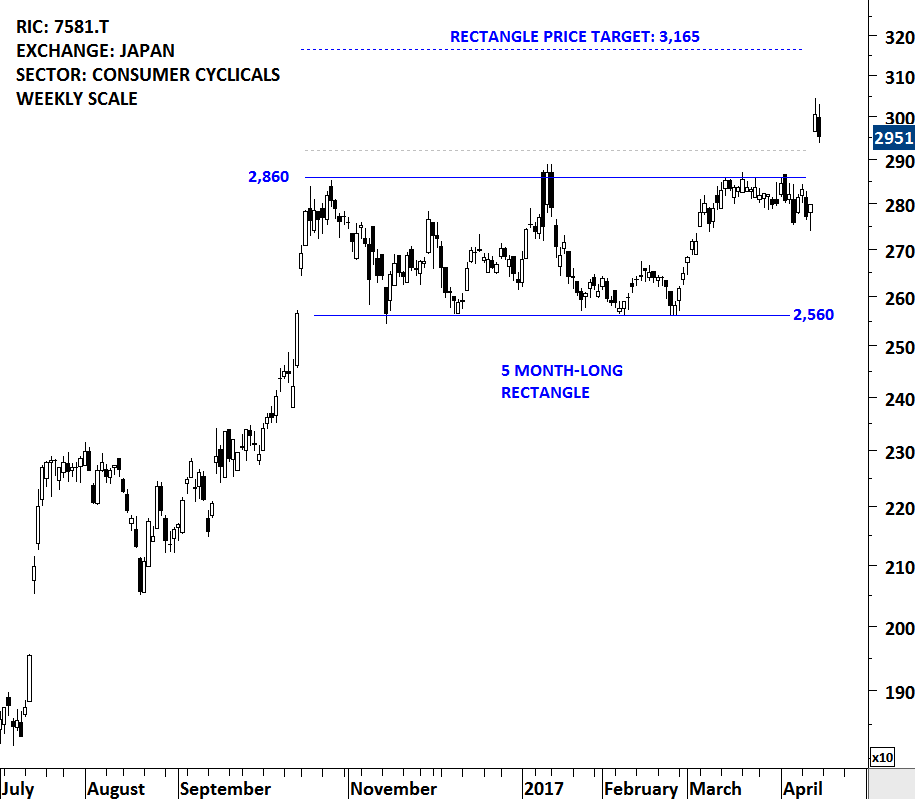
SAIZERIYA CO., LTD. is a Japan-based company primarily involved in the restaurant business. The stock is listed on the Tokyo Stock Exchange. Price chart of Saizeriya formed a 5 month-long rectangle with the strong horizontal resistance standing at 2,860 levels. Rectangle is a bullish continuation chart pattern. The daily close above 2,920 levels confirmed the breakout from the 5 month-long sideways consolidation with a possible price target of 3,165 levels.
#TECHCHARTSWATCHLIST
BRANDYWINE REALTY TRUST (BDN [4])
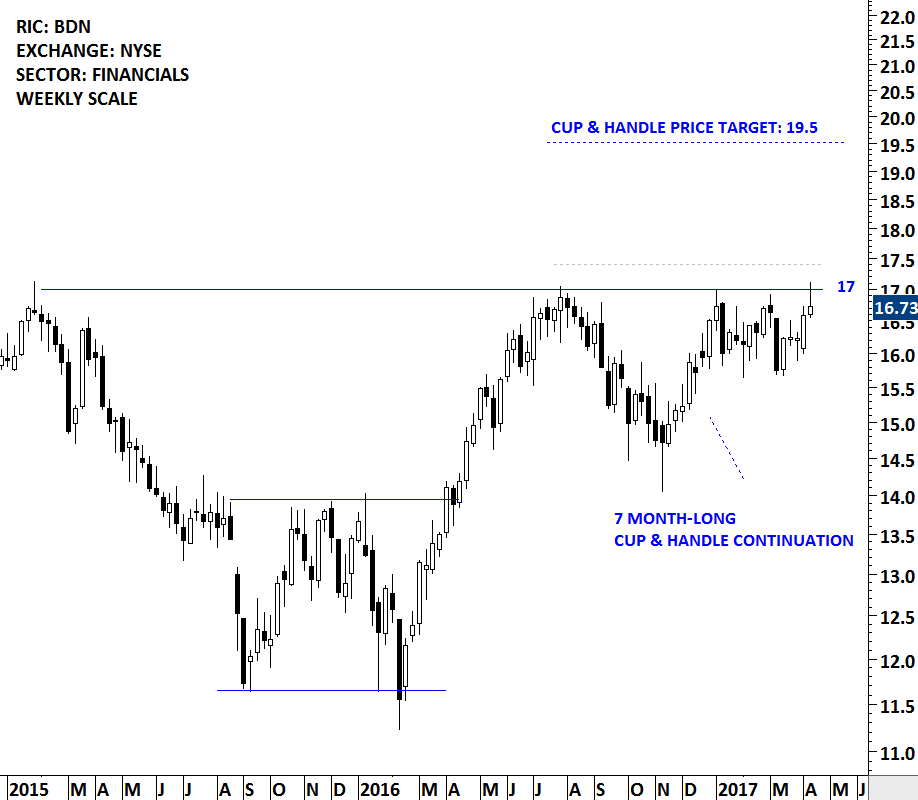
Brandywine Realty Trust is a self-administered and self-managed real estate investment trust (REIT). The stock is listed on the New York Stock Exchange. Price chart formed a 7 month-long cup & handle chart pattern with the strong horizontal resistance standing at 17 levels. Horizontal resistance at 17 levels is also the high that was tested in 2015. Breakout will clear more than 2 year-long resistance. A daily close above 17.40 levels will confirm the breakout from the bullish continuation chart pattern with a possible price target of 19.5 levels.
RIGHTMOVE PLC (RMV.L [5])
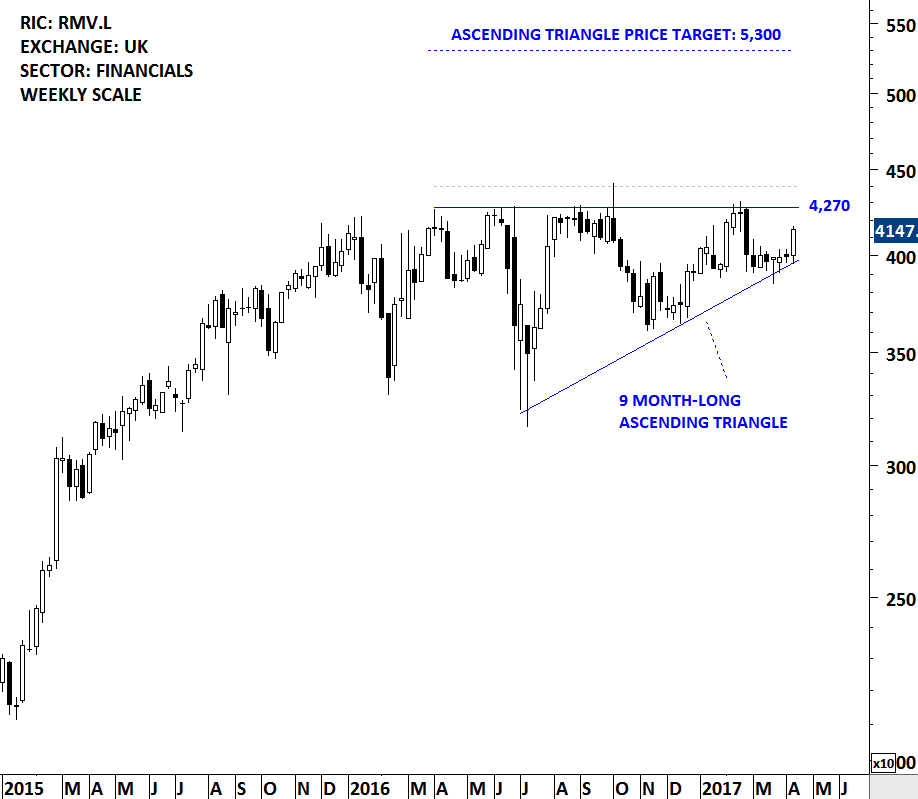
Rightmove plc is a United Kingdom-based company, which operates as a property portal. The Company’s principal business is the operation of the rightmove.co.uk Website. The Company’s Website and mobile platforms provide online property search. The stock is listed on the London Stock Exchange. Price chart formed a 9 month-long ascending triangle with the strong horizontal resistance standing at 4,270 levels. A daily close above 4,400 will complete the multi-month bullish continuation chart pattern with the possible price target of 5,300 levels.
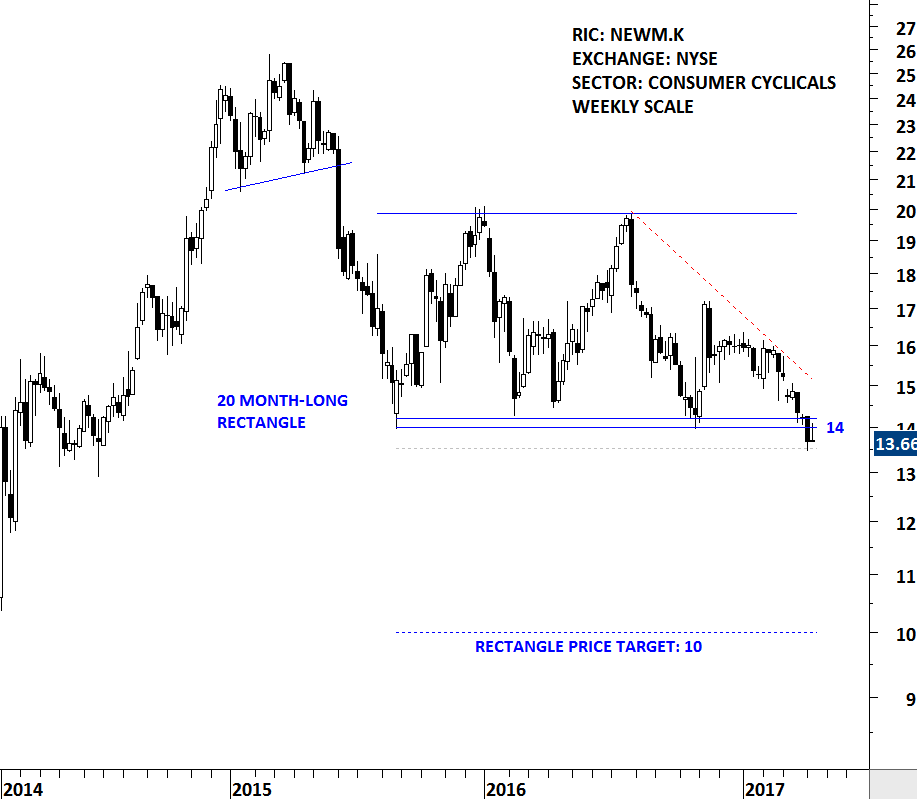
NEW MEDIA INVESTMENT GROUP (NEWM.K [6])
New Media Investment Group Inc. is a holding company. The Company owns, operates and invests in local media assets. The Company’s segments include Eastern US Publishing, Central US Publishing, Western US Publishing and BridgeTower. It focuses on owning and acquiring local media assets in small to mid-size markets. The stock is listed on the New York Stock Exchange. Price chart formed multi-month rectangle with the strong horizontal support standing at 14 levels. Last two week’s price action breached the strong support that was tested for 4 times over the course of the chart pattern. Edwards and Magee in their book Technical Analysis of Stock Trends suggest that a stock should breakout or breakdown by a min 3% margin above or below the resistance/support (on a daily closing basis) for a clear chart pattern breakout signal. A daily close below 13.50 will confirm the breakdown of the multi-month rectangle chart pattern with a possible price target of 10 levels.
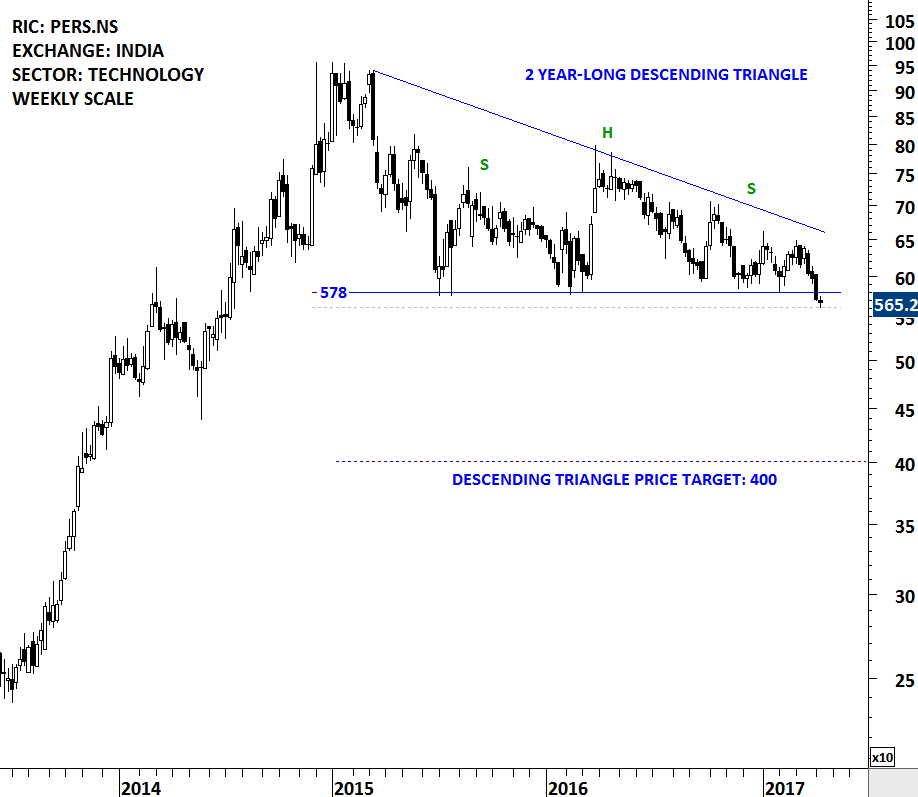
PERSISTENT SYSTEMS LTD. (PERS.NS [7])
Persistent Systems Limited is engaged in the business of building software products. The Company offers complete product life cycle services. The Company’s segments include Infrastructure and Systems, Telecom and Wireless, Life science and Healthcare, and Financial Services. The stock is listed on the National Stock Exchange of India. Price chart formed a year-long descending triangle and a multi-month H&S continuation chart pattern with the strong horizontal support standing at 578 levels. Both descending triangle and a H&S continuation in a downtrend are bearish chart patterns. A daily close below 560 levels will confirm the breakdown with a possible price target of 400 levels.
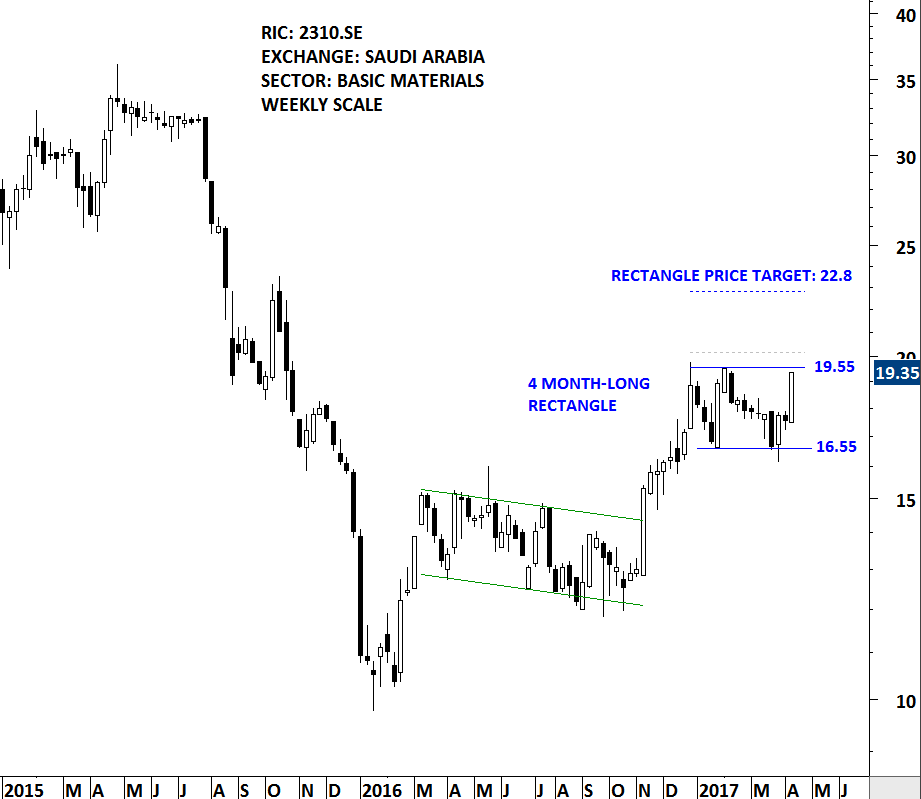
SAUDI INTERNATIONAL PETROCHEMICAL CO (2310.SE)
Saudi International Petrochemical Co SJSC (Sipchem) is a Saudi Arabia-based joint stock company engaged in the petrochemical industry sector. The stock is listed on the Saudi Arabia Stock Exchange. Price chart formed a 4 month-long rectangle continuation chart pattern with the horizontal resistance standing at 19.55 levels. A daily close above 20.15 levels will confirm the breakout with a possible price target of 22.8 levels.