It has been a volatile week in the Global equity markets. There were 2 new breakout alerts. Both stocks cleared strong multi-month horizontal resistances.
#TECHCHARTSALERT [1]
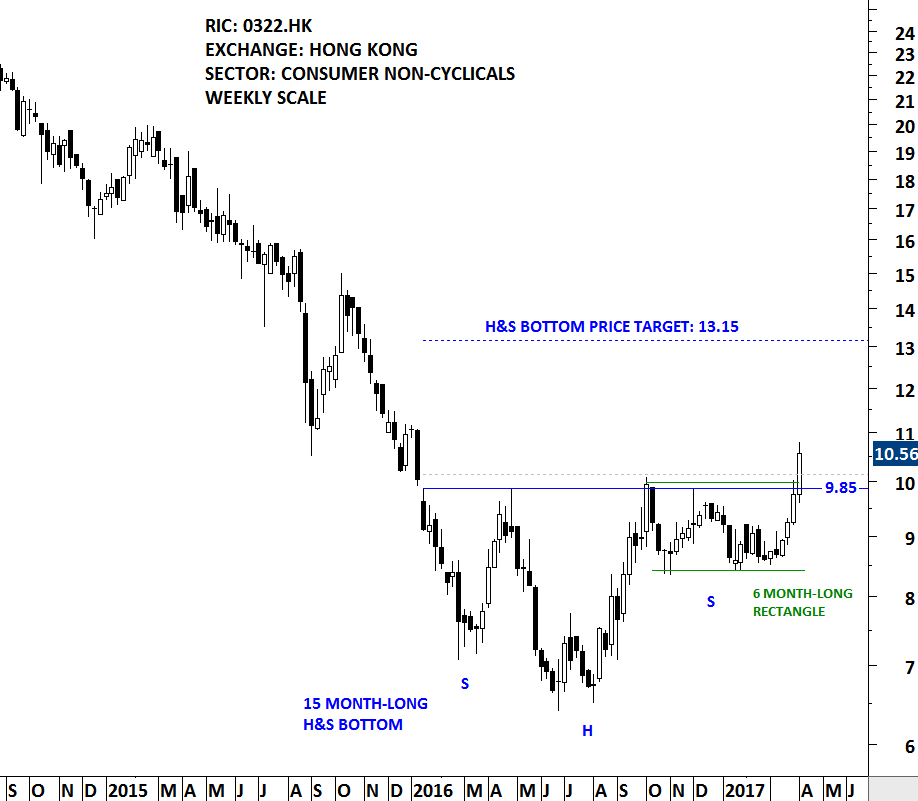
TINGYI CAYMAN ISLANDS HOLDING CORP (0322.HK [2])
Tingyi (Cayman Islands) Holdings Corp. is a Hong Kong-based investment holding company principally engaged in the production and sales of instant noodles, beverages and instant food products. The stock is listed on the Hong Kong Stock Exchange. Price chart formed a 15 month-long H&S bottom with the right shoulder in the form of a 6 month-long rectangle. The neckline of the H&S bottom standing as a resistance at 9.85 has been tested for 4 times over the past year. The daily close above 10.15 confirmed the breakout from the multi-month base formation. 9.85 levels will now become support. Possible chart pattern price target stands at 13.15 levels.
MYERS INDUSTRIES (MYE [3])
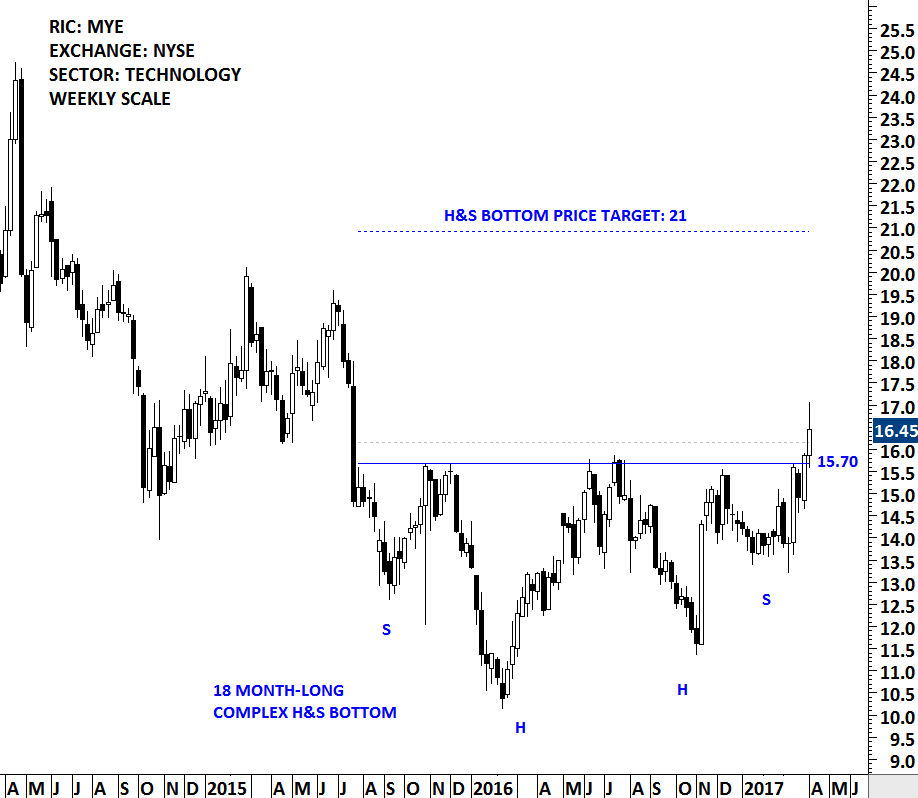
Myers Industries, Inc. is an international manufacturing and distribution company. The stock is listed on the New York Stock Exchange. Price chart formed a possible multi-month base formation in the form of an ascending triangle. The multi-month chart pattern can also be identified as a complex H&S bottom. The chart below analyzes the completed chart pattern as a multi-month complex H&S bottom. The daily close above 16.15 levels confirmed the breakout from the multi-month base formation with a possible price target of 21 levels. The horizontal boundary has been tested for six times over the course of the chart pattern. This week’s breakout finally cleared the strong horizontal resistance at 15.70 levels which will become support for the coming weeks.
This week there are 9 additions to the TECHCHARTS WATCHLIST. Most of the chart patterns have well-defined horizontal boundaries.
#TECHCHARTSWATCHLIST [4]
In the last quarter of 2016, following the U.S. election, major U.S. equity benchmarks broke out to all-time high levels and put an end to a 2 year-long sideways consolidation. Once a stock or index clears a long-term resistance, that level becomes a strong support. Validity test for the breakout is the ability for the stock to remain above the support/resistance area.
FEDEX CORP (FDX [5])
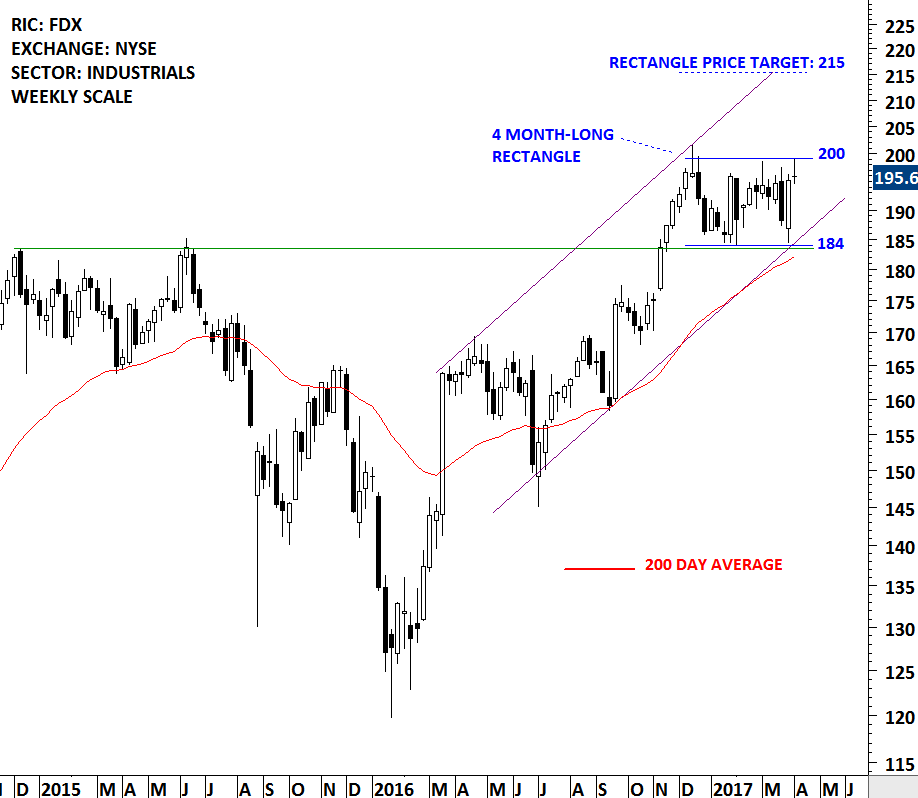
FedEx Corporation (FedEx) provides a portfolio of transportation, e-commerce and business services through companies competing collectively, operating independently and managed collaboratively, under the FedEx brand. The Company’s segments include FedEx Express, TNT Express, FedEx Ground, FedEx Freight and FedEx Services. FedEx is listed on the New York Stock Exchange. Following the breakout to all time highs in November 2016, price chart formed a 4 month-long rectangle with the boundaries between 184 and 200. The sideways consolidation is taking place above the strong horizontal support. FedEx should resume its uptrend once the bullish continuation chart pattern is completed. A daily close above 200 levels will possibly resume the uptrend towards the chart pattern price target of 215.
ENERSYS (ENS [6])
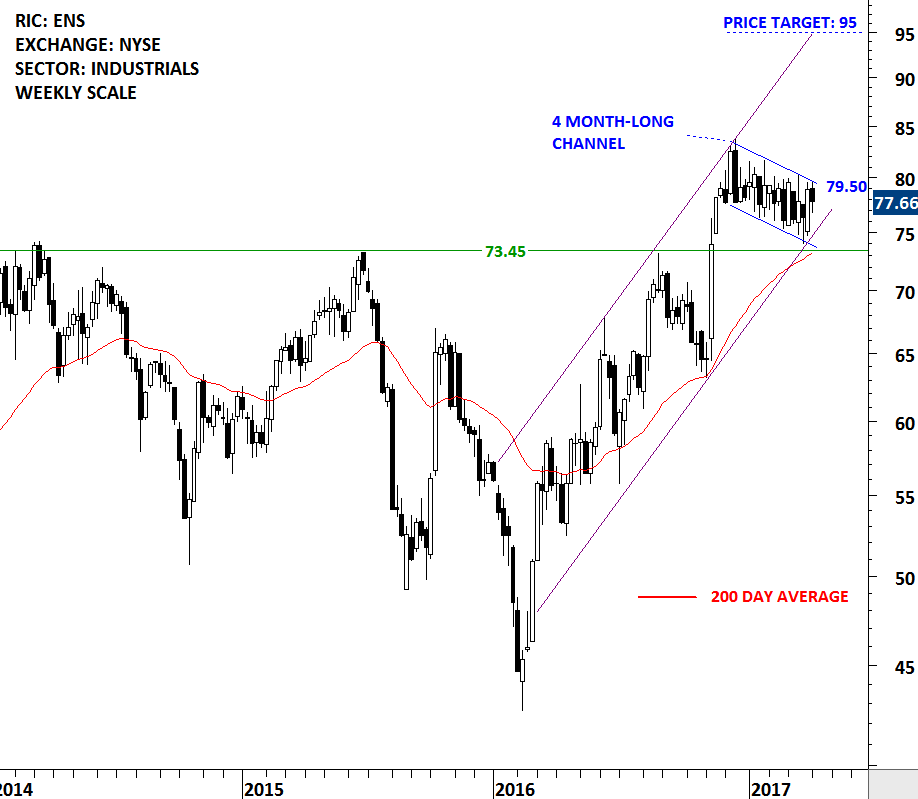
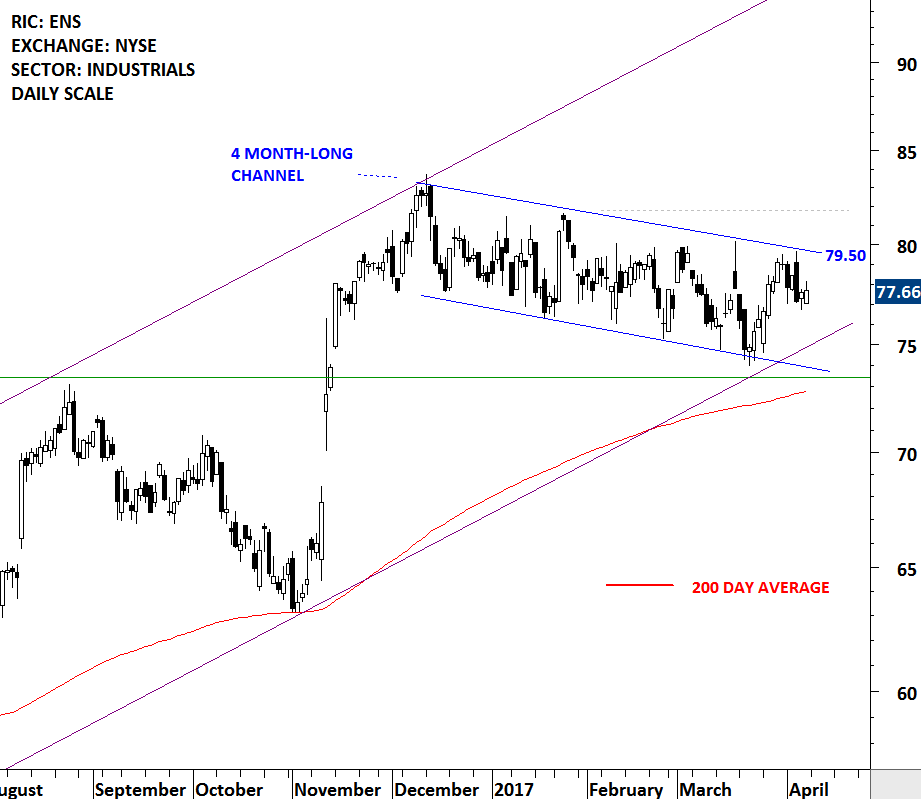
EnerSys is a manufacturer, marketer and distributor of industrial batteries. The Company manufactures, markets and distributes related products, such as chargers, power equipment, outdoor cabinet enclosures and battery accessories, and provides related after-market and customer-support services for industrial batteries. EnerSys is another U.S. equity that broke out to all-time high levels in November 2016. Price chart formed a 4 month-long downward trend channel.
Both FedEx and EnerSys have the same technical outlook. Both stocks broke out to all-time high levels that was a major positive shift in the technical outlook. Following their strong breakouts both stocks have pulled back to their long-term averages and major support areas. The upper boundary of the 4 month-long trend channel stands as resistance at 79.50 levels. Edwards and Magee in their book Technical Analysis of Stock Trends suggest that a stock should breakout by a min 3% margin above the resistance (on a daily closing basis) for a clear chart pattern breakout signal. According to this guideline, a daily close above 81.80 will confirm the breakout. Possible chart pattern price target stands at 95 levels.
TOTAL SA (TOT [7])
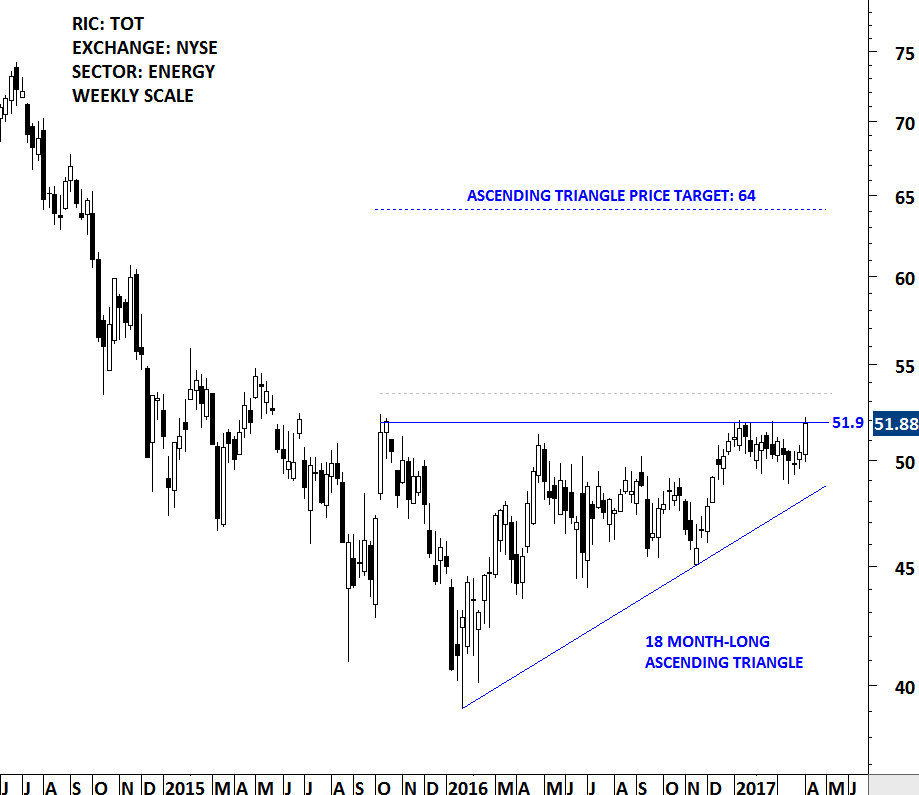
Total S.A. (Total) is an oil and gas company. The stock is listed on the New York Stock Exchange via depository receipt. Price chart formed an 18 month-long ascending triangle with the strong horizontal resistance standing at 51.9 levels. Over the course of the chart pattern the horizontal boundary was tested for 4 times. This week’s price action challenged the strong resistance once again for a possible breakout. A daily close above 53.50 levels will confirm the breakout form the bullish ascending triangle. In this case the bullish continuation chart pattern can act as a major base reversal with a chart pattern price target of 64 levels.
INVESCO MORTGAGE CAPITAL (IVR [8])
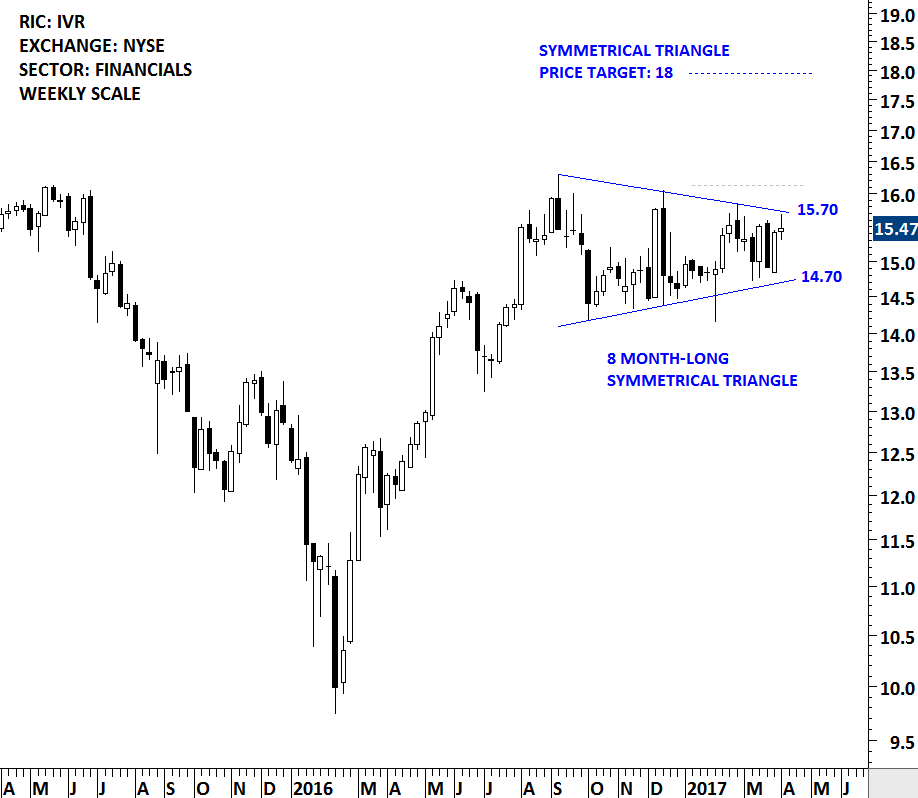
Invesco Mortgage Capital Inc. is a holding company, which conducts its businesses through IAS Operating Partnership LP (the Operating Partnership) and subsidiaries. The Company’s objective is to provide risk-adjusted returns to its investors through dividends and through capital appreciation. It is externally managed and advised by Invesco Advisers, Inc. The stock is listed on the New York Stock Exchange. Price chart formed an 8 month-long symmetrical triangle with the boundaries between 14.70 and 15.70. A daily close above 16.15 levels will confirm the breakout from the 8 month-long sideways consolidation with a possible price target of 18 levels.
EMBOTELLADORA ANDINA SA (AKOb [9])
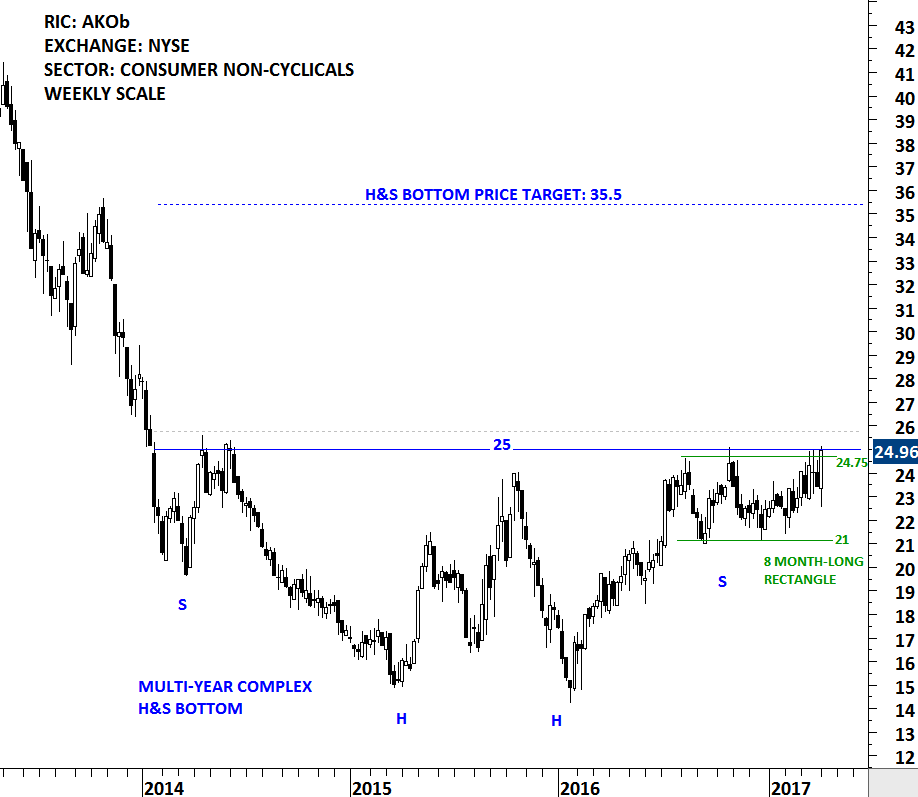
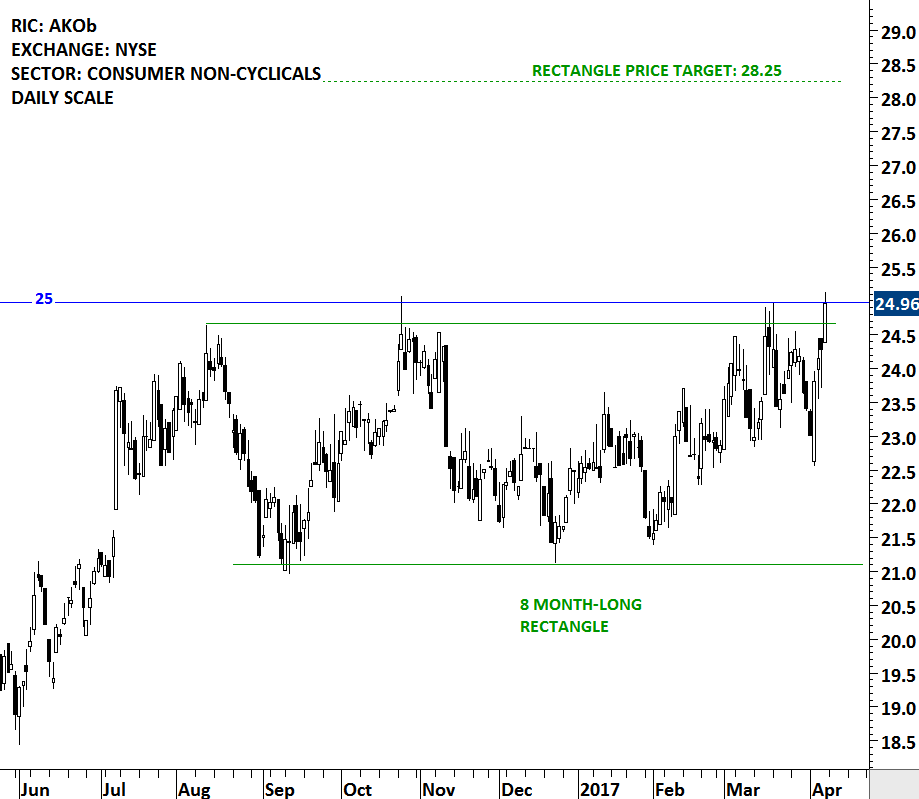
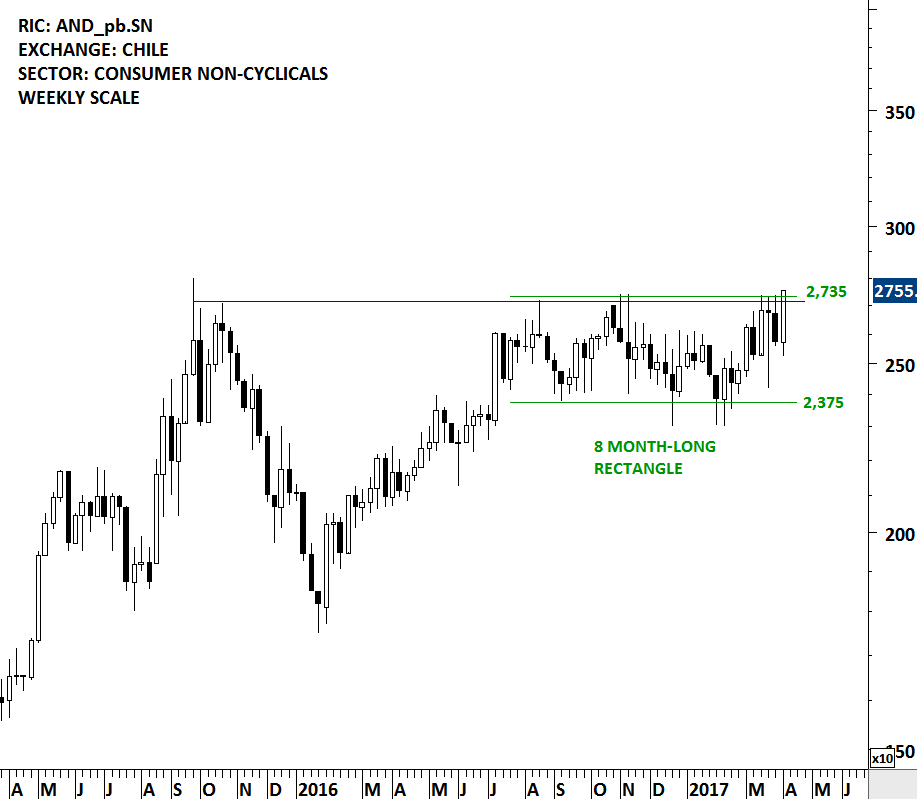
Embotelladora Andina S.A. (Andina) is a bottler of Coca-Cola trademark beverages in Latin America. The Company operates in four segments: Chile, Brazil, Argentina and Paraguay. It produces and distributes fruit juices, other fruit-flavored beverages and mineral and purified water in Chile, Argentina and Paraguay under trademarks owned by The Coca-Cola Company. The stock is listed on the Chile Santiago Stock Exchange and also on the New York Stock Exchange through depository receipt. Price chart formed an 8 month-long rectangle and a multi-month complex H&S bottom reversal. Both the medium-term and long-term chart patterns are bullish in nature. A daily close above 25.75 levels will confirm breakout from both chart patterns. Possible price target for the rectangle continuation stands at 28.25 levels. H&S bottom reversal price target is at 35.5 levels.
THOMAS COOK GROUP (TCG.L [10])
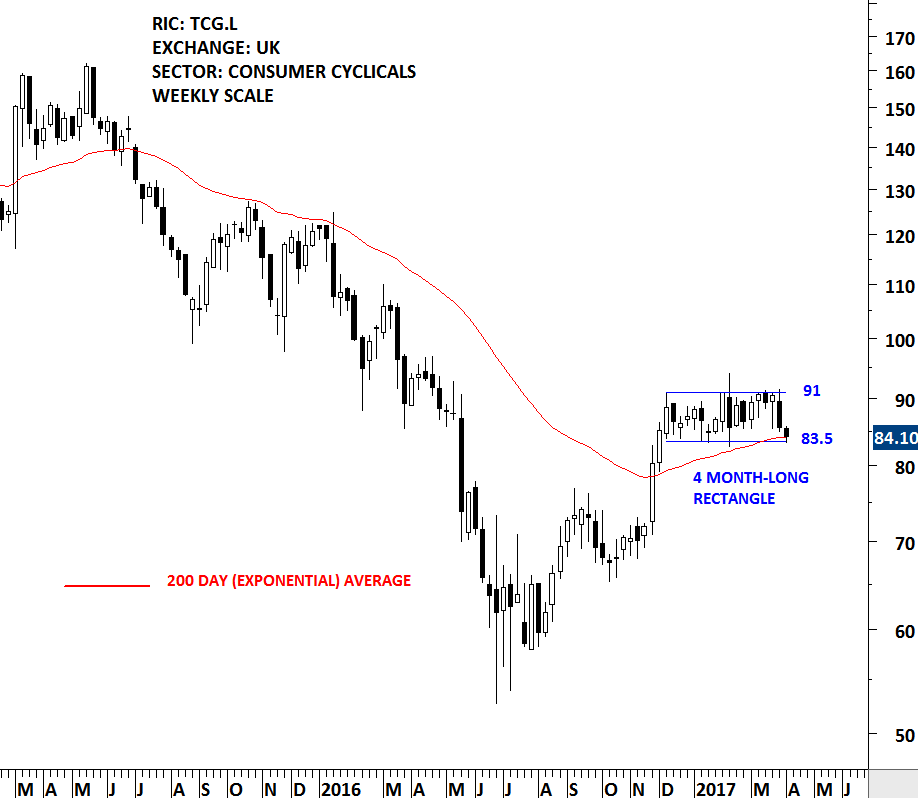
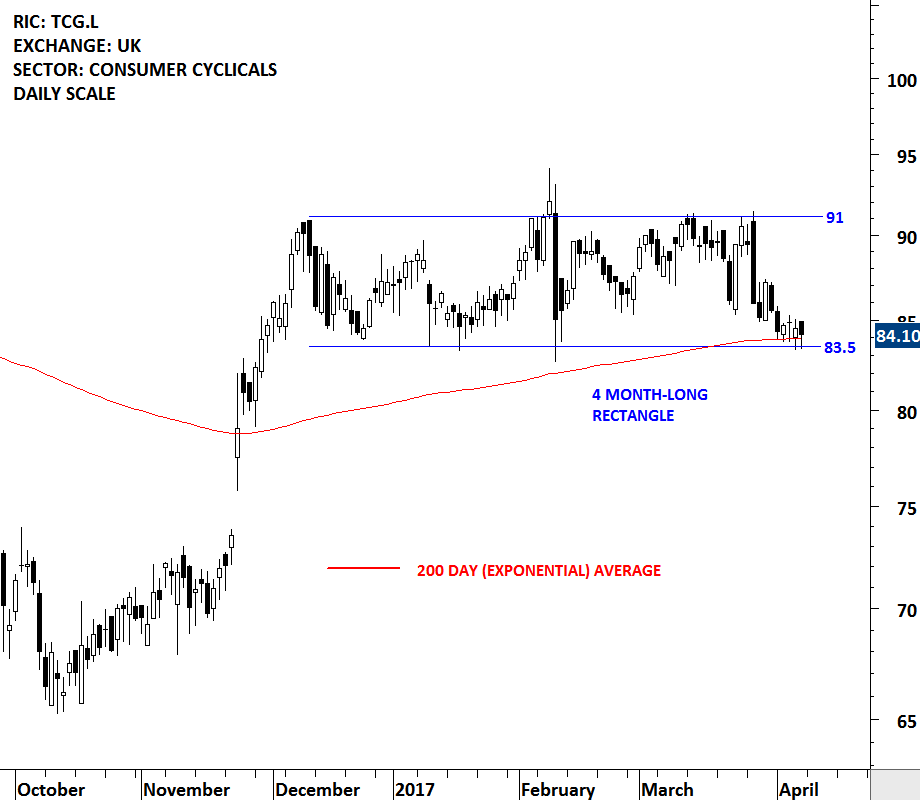
Thomas Cook Group plc is a holiday company. The Company’s segments are United Kingdom, Continental Europe, Northern Europe and Airlines Germany. Its hotels and resort brands include Sentido, Sunprime, Sunwing, Sunconnect, Smartline and Casa Cook. It has airline operations in Belgium, Scandinavia and the United Kingdom. It has a fleet of over 90 aircraft under the Thomas Cook Airlines and Condor brands. It operates from approximately 20 source markets in Europe and China. The stock is listed on the London Stock Exchange. Price chart formed a 4 month-long rectangle. Latest correction tested the lower boundary of the 4 month-long sideways consolidation for the 5th time. The lower boundary at 83.50 is also the level for the 200 day average, a widely followed trend indicator. It is important to keep a close eye on this strong support level. A breakdown of the rectangle will suggest lower prices. However, a possible rebound from the current levels will increase the likelihood of the rectangle chart pattern forming as a continuation. A continuation chart pattern signals that a trend will continue once the pattern is complete.
RYANAIR HOLDINGS PLC (RYA.L [11])
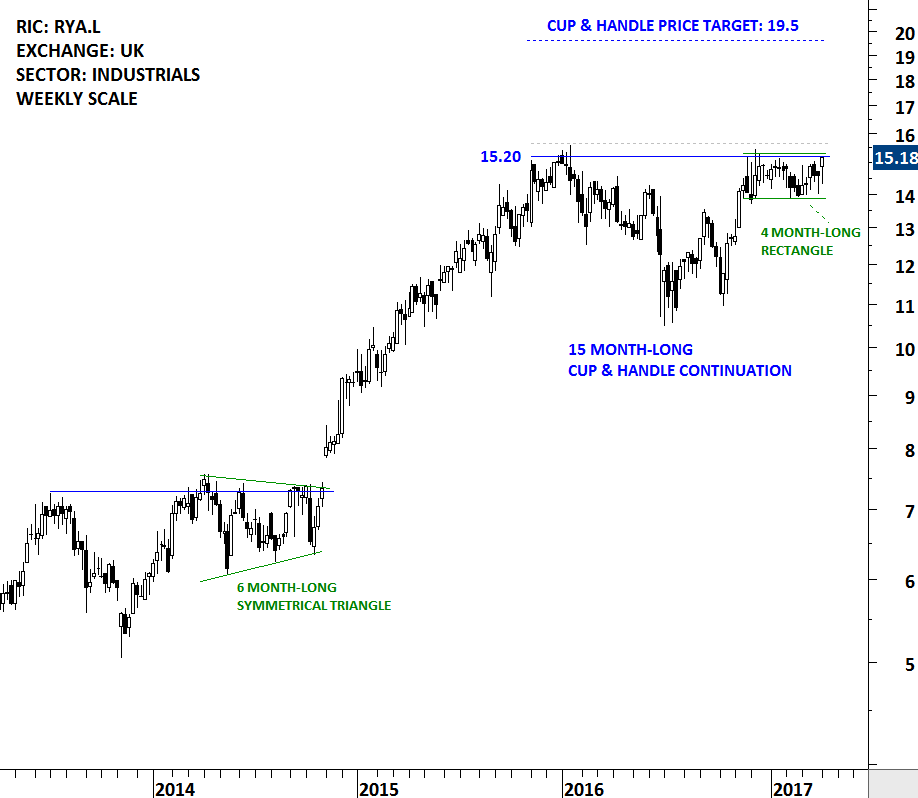
Ryanair Holdings plc (Ryanair Holdings) is a holding company for Ryanair Limited (Ryanair). Ryanair operates an ultra-low fare, scheduled-passenger airline serving short-haul, point-to-point routes between Ireland, the United Kingdom, Continental Europe, Morocco and Israel. The stock is listed on the London Stock Exchange. Price chart formed a 15 month-long cup & handle chart pattern with the strong horizontal resistance standing at 15.20 levels. The handle part of the chart pattern is also a 4 month-long rectangle. Both the rectangle and and the long-term cup & handle chart pattern has bullish implications. A daily close above 15.65 levels will confirm the breakout with a possible price target of 19.5 levels.
SAIZERIYA CO (7581.T [12])
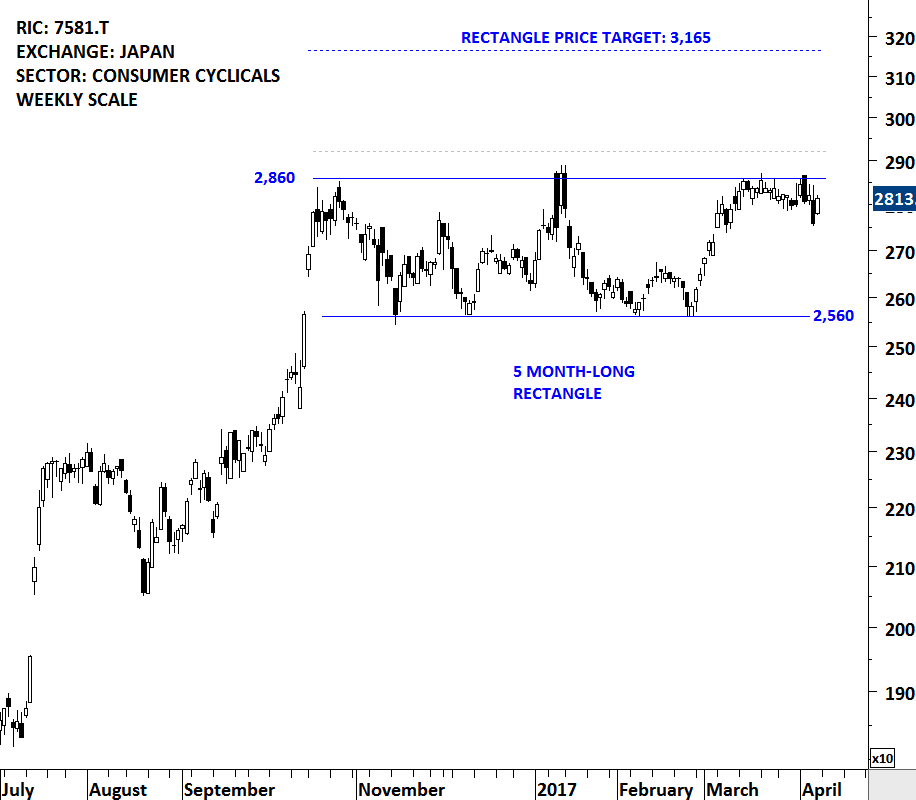
SAIZERIYA CO., LTD. is a Japan-based company primarily involved in the restaurant business. The stock is listed on the Tokyo Stock Exchange. Price chart of Saizeriya formed a 5 month-long rectangle with the strong horizontal resistance standing at 2,860 levels. Rectangle is a bullish continuation chart pattern. A daily close above 2,920 levels will confirm the breakout from the 5 month-long sideways consolidation with a possible price target of 3,165 levels.
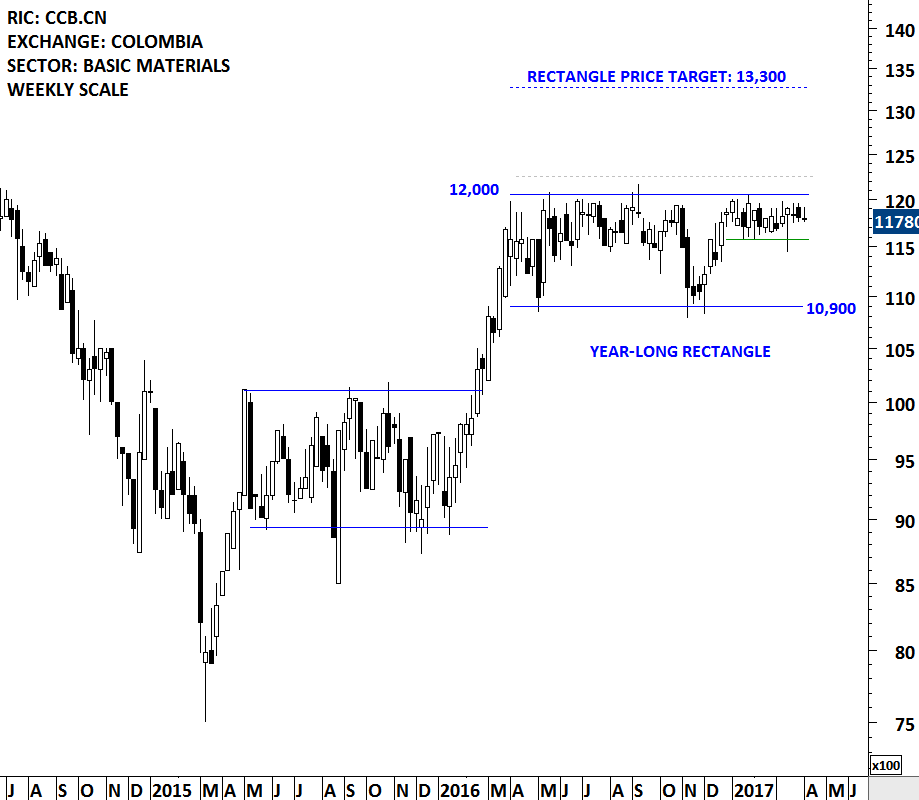
CEMENTOS ARGOS SA (CCB.CN [13])
Cementos Argos SA is a Colombia-based company engaged in the production of cement, aggregates and concrete mix products, such as white and gray cement, lime and mortar. It is also involved in the operation and management of quarries and deposits of clay and limestone. The stock is listed on the Colombia Stock Exchange. Price chart formed a year-long rectangle with the strong horizontal boundary standing at 12,000 levels. Over the past year, 12,000 levels was tested several times. Last few month’s tight consolidation right below the upper boundary of the year-long rectangle can be an early indication of an upward break. A daily close above 12,250 levels will confirm the breakout with a possible price target of 13,300 levels.
