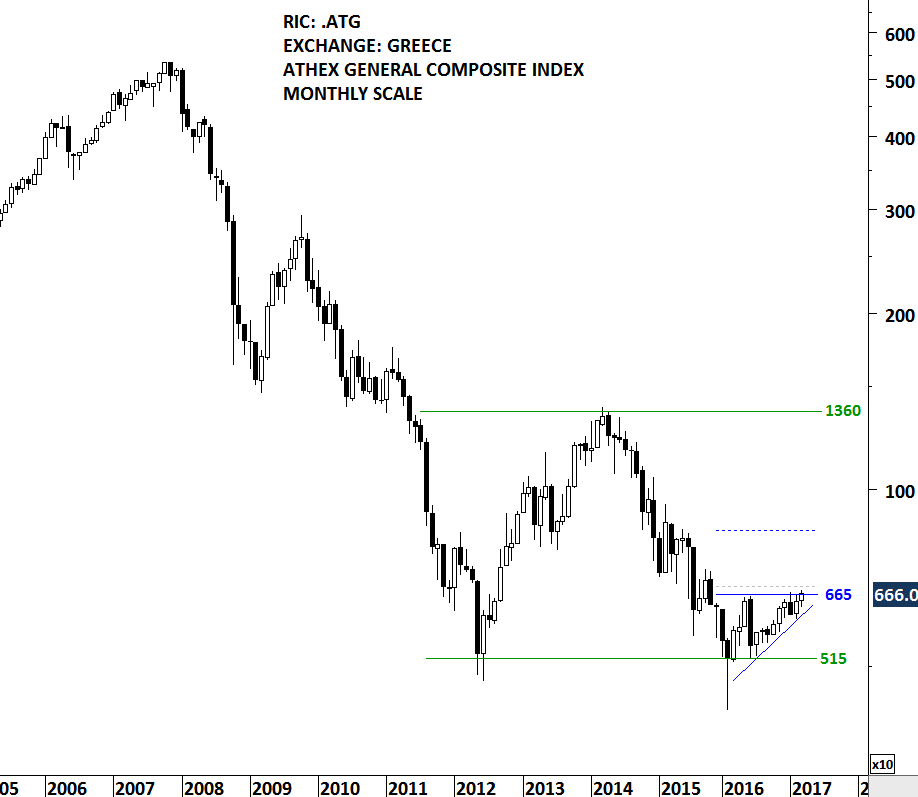
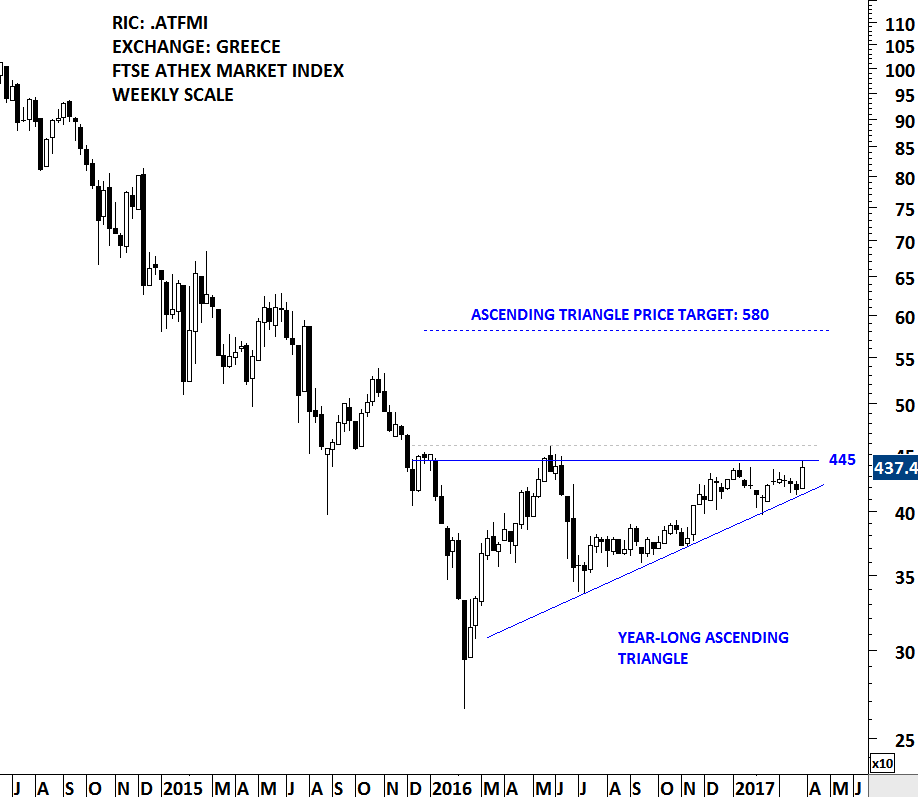
After several years of downtrend and a major bear market, Greek equities can offer great opportunities in the following weeks/months. This week’s update features two benchmark equity indices from Greece. Athens General Composite index with a long-term view and FTSE Athex Market index with the latest bullish chart development. In the beginning of 2016, Athens General Index rebounded from the lows of 2012. Over the past year the index remained sideways in a choppy trading range. Last one year’s range bound price action is possibly a bullish ascending triangle with the horizontal boundary standing at 445 levels for the FTSE Athex Market Index and at 665 levels for the Athens General Composite index. The upward sloping lower boundary of the ascending triangle gives the chart pattern its bullish bias. Higher lows is indicative of increasing demand. A daily close above 460 levels on the FTSE Athex Market Index will confirm the breakout from the year-long ascending triangle with a possible price target of 580 levels.
ATHENS GENERAL INDEX (.ATG [1])
FTSE ATHEX MARKET INDEX (.ATFMI)
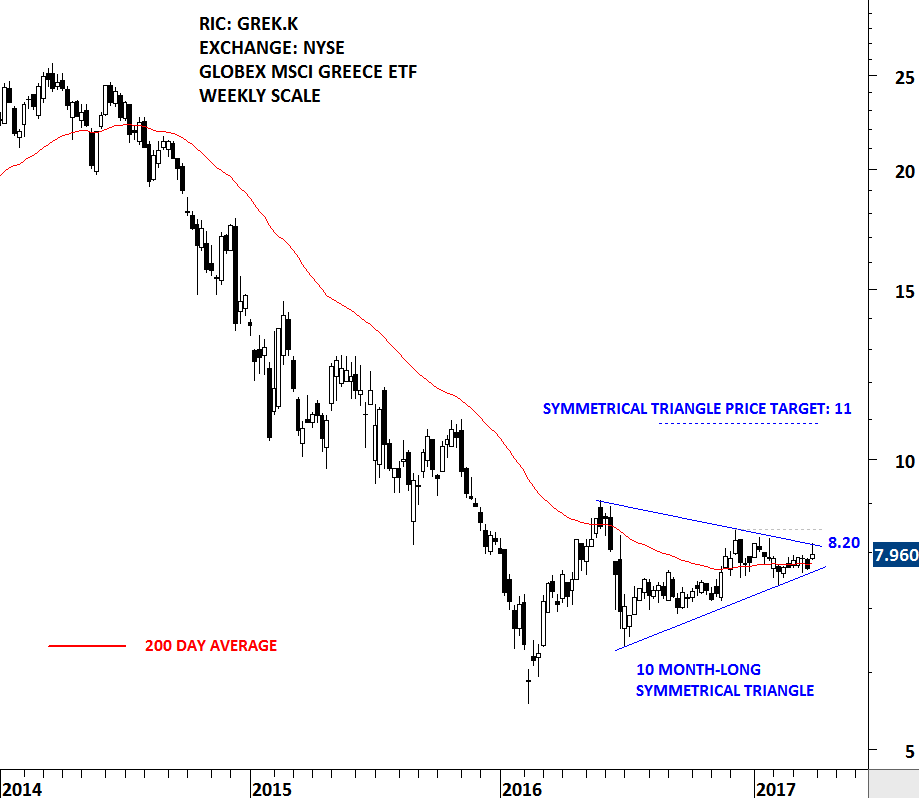
GLOBAL X MSCI GREECE ETF (GREK.K [2])
One of the liquid Greek equity ETF is listed on the New York Stock Exchange. The Fund seeks to investment results that correspond generally to the price and yield performance of the FTSE/Athex 20 Index. The Index is designed to reflect broad based equity market performance in Greece. The Fund invest at least 80% of its total assets in securities on companies that are domiciled in Greece. Globex MSCI Greece ETF (GREK) is forming a 10 month-long symmetrical triangle. A daily close above 8.45 levels will confirm the breakout from the sideways consolidation with a possible price target of 11 levels. It is important to note that such breakout will also establish a trend above the 200 day average after almost 3 years of downtrend.
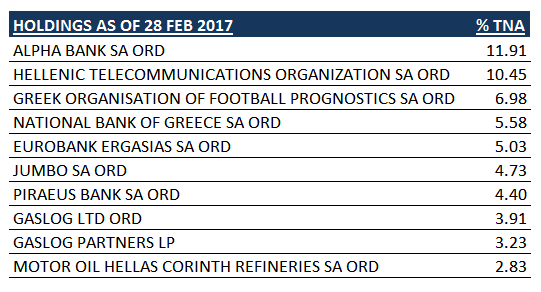
Below are the top 10 holdings of the GREK ETF that is listed on the NYSE. The holdings are as of 28 February 2017.
#TECHCHARTSALERT
This week there were 4 new chart pattern breakout signals.
MOTA ENGIL SGPS (MOTA.LS [3])
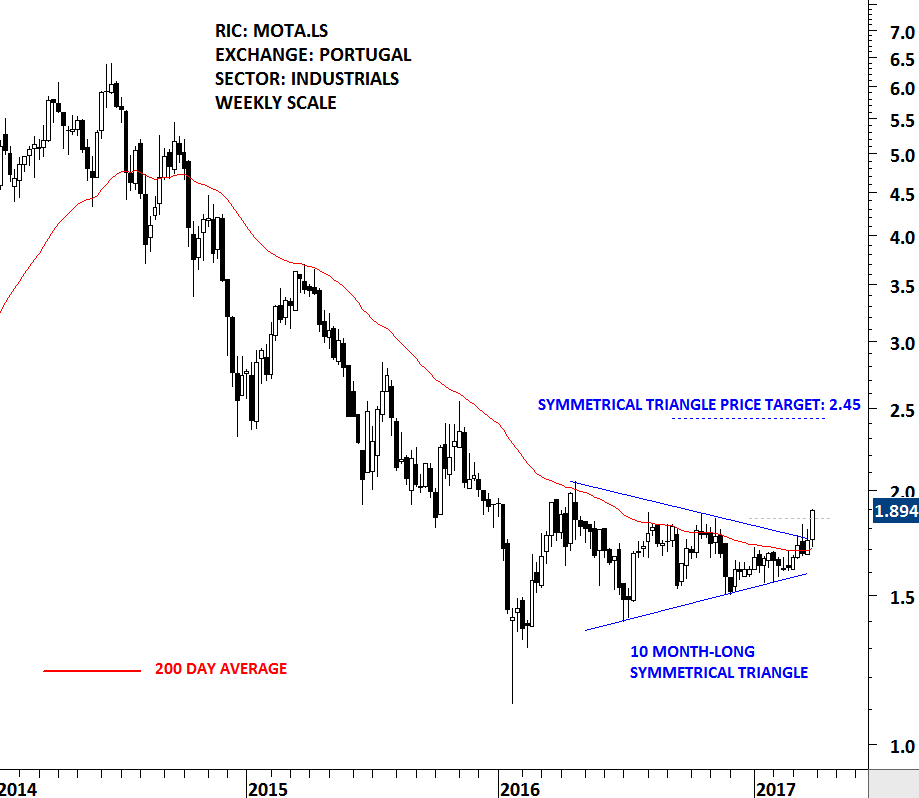
By looking at MOTA ENGIL price chart one can easily think that it is a stock that has a high weight in the GREK ETF. They have been in a downtrend for the past three years and also formed a similar 10 month-long symmetrical triangle. However MOTA ENGIL is a stock that is listed on the Lisbon Stock Exchange. A chart pattern is usually a result of accumulation/distribution in a specific instrument. In this case the symmetrical triangle that formed as a possible reversal chart pattern on both the GREK ETF and MOTA ENGIL signal a possible change in trend as a result of accumulation in the analyzed instruments. Mota Engil SGPS SA is a Portugal-based company primarily engaged in the construction industry. The company divides its business into three main segments: Engineering and Construction; Environment and Services, and Transport Concessions. The daily close above 1.85 levels confirmed the breakout from the 10 month-long symmetrical triangle that is possibly acting as a reversal chart pattern. Symmetrical triangle price target stands at 2.45 levels.
ALSTOM SA (ALSO.PA [4])
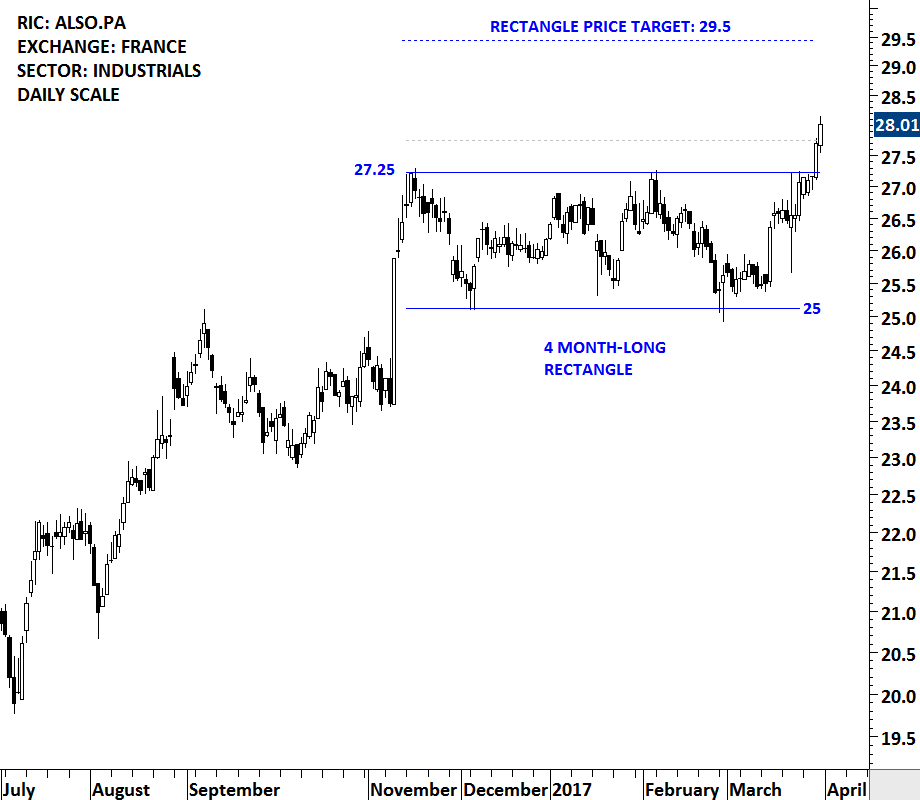
Alstom SA (Alstom) offers rail transport equipment, systems, services and signaling for urban, suburban, regional and main line passenger transportation, as well as for freight transportation. The company’s portfolio includes trains, signaling solutions, integrated systems (including infrastructure) and services. The stock is listed on the Paris Stock Exchange. Price chart formed a 4 month-long rectangle with the strong horizontal boundary standing at 27.25 levels. After testing the upper boundary of its consolidation for 4 times, the daily close above 27.75 levels confirmed the breakout from the bullish continuation chart pattern with a possible price target of 29.5 levels.
BOYD GAMING (BYD [5])
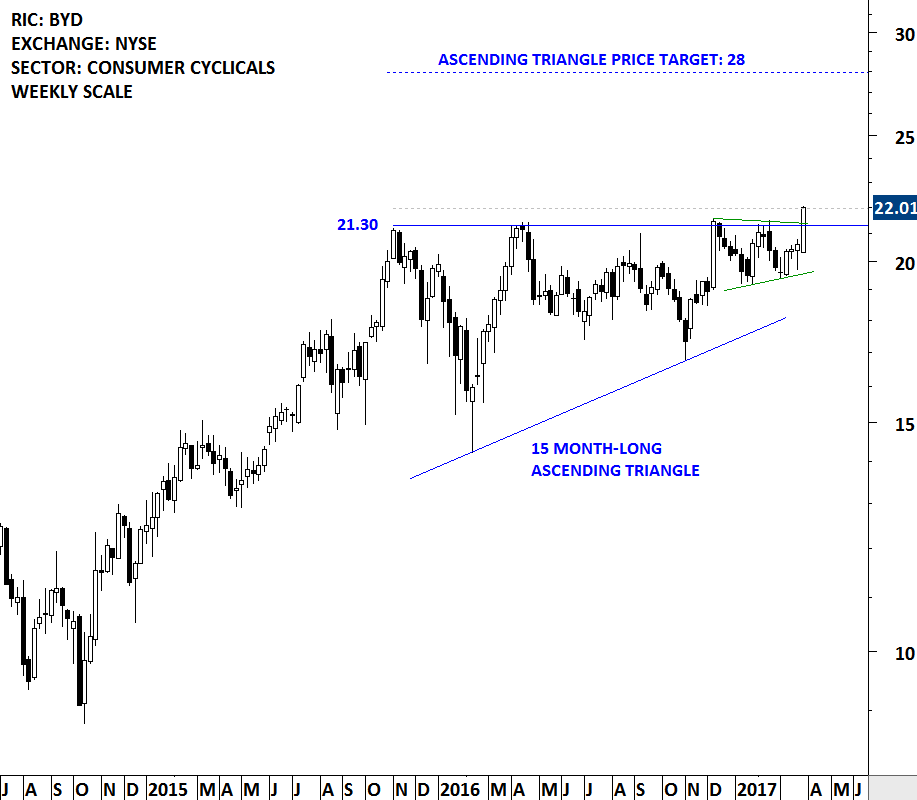
Boyd Gaming Corporation is a multi-jurisdictional gaming company. The company is listed on the NYSE. Price chart formed a 15 month-long ascending triangle with the strong horizontal boundary standing at 21.30 levels. Ascending triangle is considered to be a bullish continuation chart pattern. On Friday, the daily close above 21.95 levels confirmed the breakout after the 6th test of the upper boundary. Price target for the ascending triangle stands at 28 levels.
LUMBER LIQUIDATORS HOLDINGS INC (LL [6])
Lumber Liquidators Holdings, Inc. is a multi-channel specialty retailer of hardwood flooring, and hardwood flooring enhancements and accessories. The Company offers hardwood species, engineered hardwood, laminate and resilient vinyl flooring direct to the consumer. The stock is listed on the New York Stock Exchange. Price chart formed an 18 month-long H&S bottom with the strong horizontal resistance standing at 19.80 levels. H&S bottom, especially when it spreads over multi-months, can act as a major trend reversal. On Friday, the daily close above 20.50 levels confirmed the breakout from the lengthy base formation with a possible price target of 30 levels.

#TECHCHARTSWATCHLIST
Below are 2 additions to the watchlist and an update on two other securities that are now one step closer to a possible breakout.
TINGYI CAYMAN ISLANDS HOLDING CORP (0322.HK [7])
Tingyi (Cayman Islands) Holdings Corp. is a Hong Kong-based investment holding company principally engaged in the production and sales of instant noodles, beverages and instant food products. The stock is listed on the Hong Kong Stock Exchange. Price chart formed a 15 month-long H&S bottom with the right shoulder in the form of a 6 month-long rectangle. The neckline of the H&S bottom standing as a resistance at 9.85 has been tested for 4 times over the past year. A daily close above 10.15 will confirm the breakout from the multi-month base formation with a possible price target of 13.15.

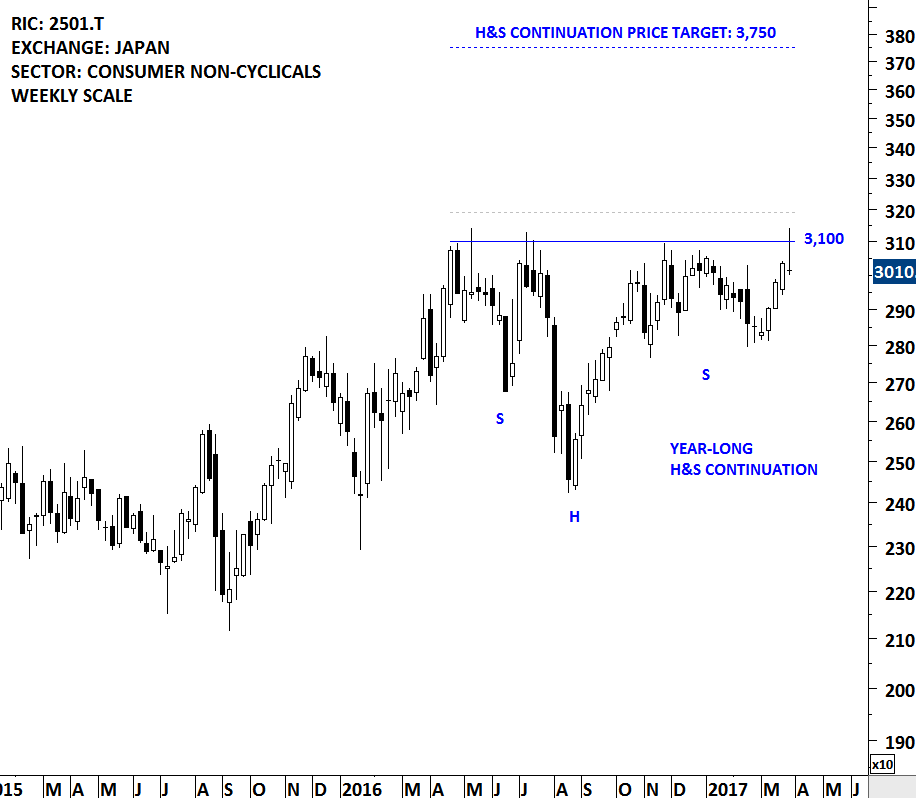
SAPPORO HOLDINGS LTD (2501.T [8])
SAPPORO HOLDINGS LIMITED is an alcohol manufacturer. The stock is listed on the Tokyo Stock Exchange. Price chart formed a year-long H&S continuation chart pattern with the strong horizontal boundary acting as resistance at 3,100 levels. Over the past year the neckline has been tested for 4 times. A daily close above 3,190 levels will confirm the breakout from the bullish continuation chart pattern with the possible price target of 3,750.
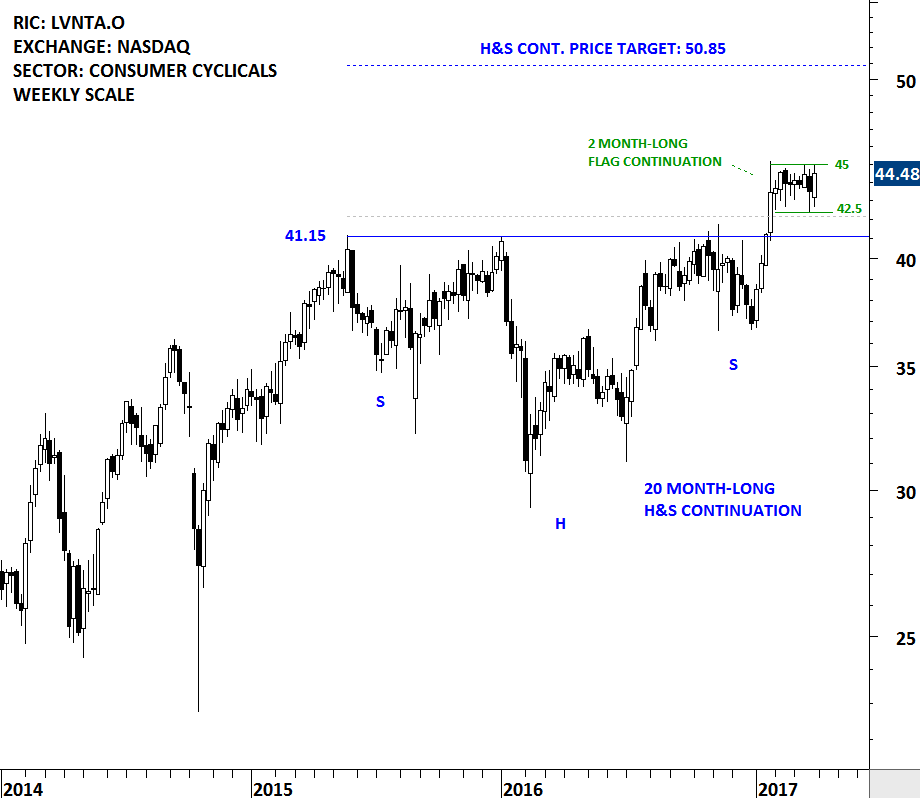
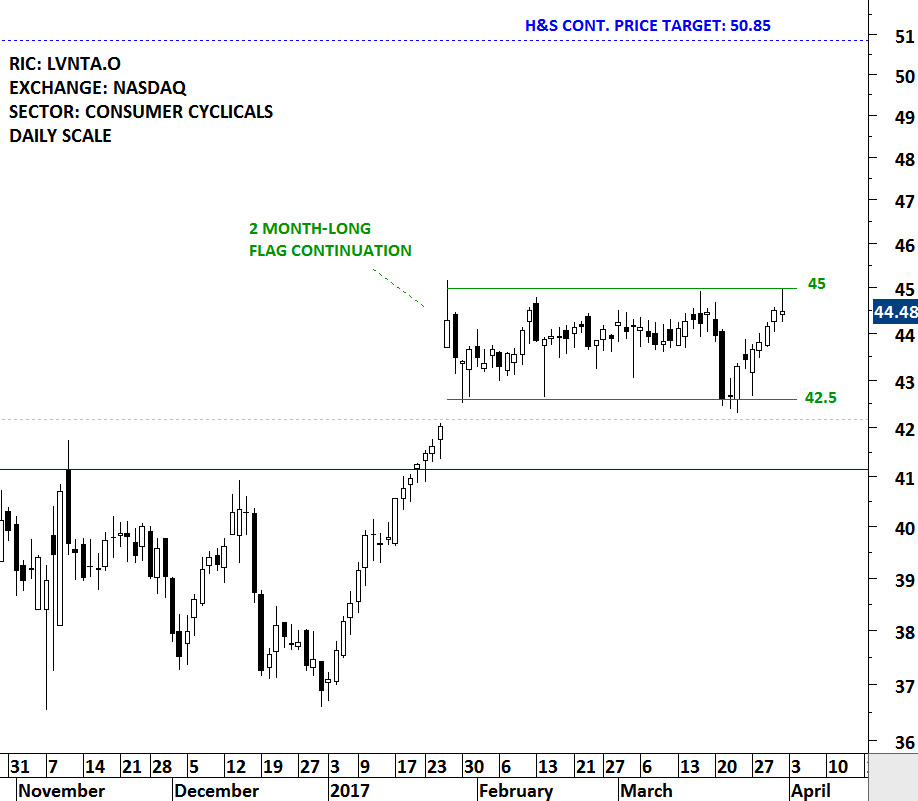
LIBERTY INTERACTIVE CORP. (LVNTA.O [9])
LIBERTY INTERACTIVE CORP. is a consumer cyclical company that is listed on the NASDAQ. The company owns interests in subsidiaries and other companies that are engaged in the video and digital commerce industries. The stock price formed a 20 month-long H&S continuation chart pattern with the strong horizontal resistance standing at 41.15 levels. During late January LIBERTY INTERACTIVE broke out of its multi-month continuation chart pattern. Following that breakout the stock entered into another sideways consolidation that can be identified as a flag/rectangle with the boundaries between 42.5 and 45. Breakout from the 2 month-long consolidation will resume the uptrend towards the chart pattern price target at 50.85 levels.
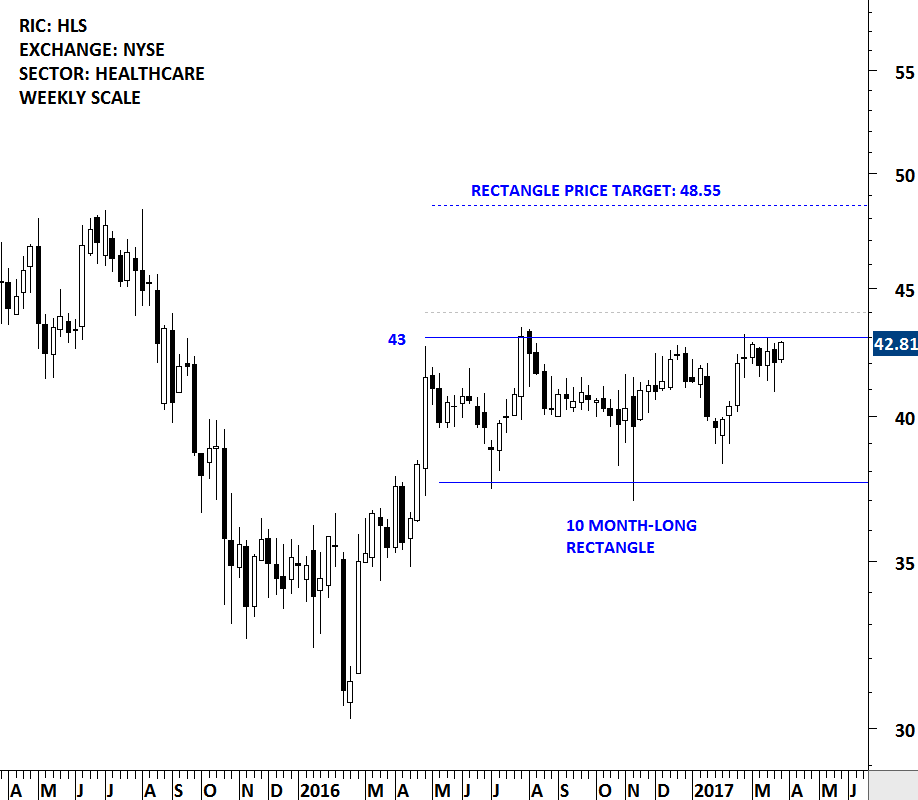
HEALTH SOUTH CORP (HLS [10])
Health South Corporation is a provider of post acute healthcare services, offering both facility based and home-based post acute services in over 30 states and Puerto Rico through its network of inpatient rehabilitation hospitals, home health agencies and hospice agencies. The stock is listed on the New York Stock Exchange. Price chart formed a 10 month-long rectangle with the strong horizontal boundary standing at 43 levels. Rectangles are usually continuation chart patterns. A daily close above 44 levels will confirm the breakout with a possible price target of 48.55 levels.