
Global equity markets continue to offer great opportunities and text book chart pattern developments. In this update I bring to your attention well-defined chart patterns from Asia, Europe, North America and Emerging Markets that are candidates for possible breakouts and I also report fresh breakout alerts. Before we move on to equity markets, I want to draw your attention to a possibility developing in the interest rates and bonds market. During the weekly review of financial markets, I spotted the similar chart development on almost all kinds of bond market ETFs.
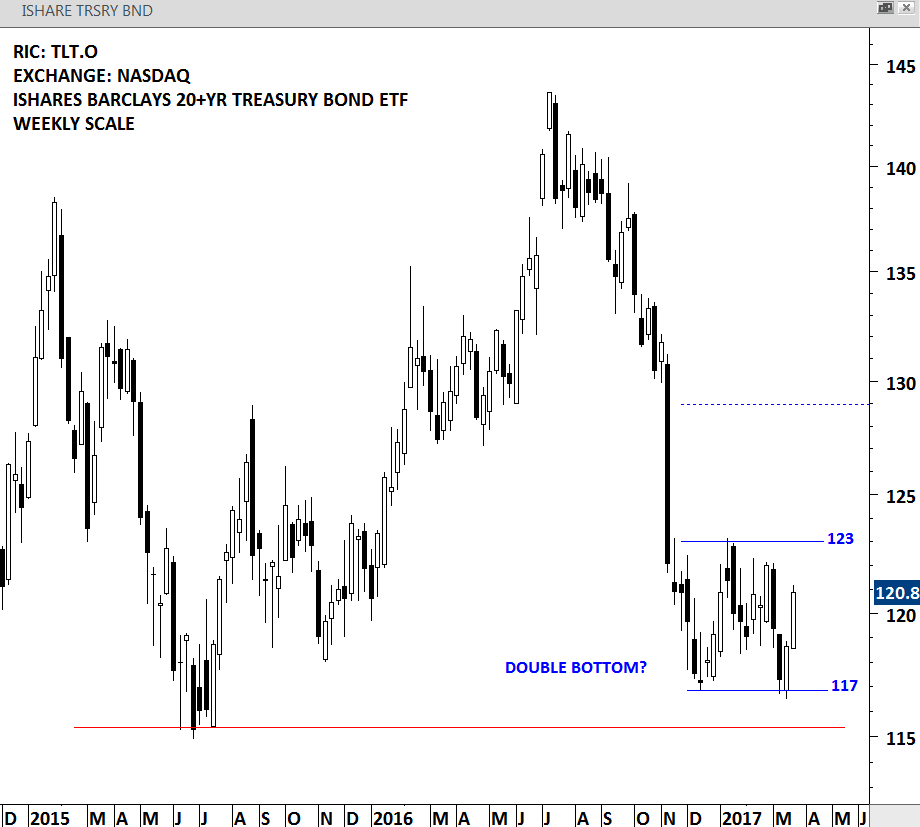
ISHARES BARCLAYS 20+YR TREASURY BOND ETF (TLT.O [1])
ISHARES BARCLAYS 20+YR TREASURY BOND ETF is an exchange traded fund listed on the Nasdaq Stock Exchange. The Fund seeks investment results that correspond generally to the price and yield performance of the long-term sector of the U.S. Treasury market as defined by the Barclays Capital 20+ Year Treasury Index. Price chart of this ETF is possibly forming a 4 month-long double bottom. This chart pattern is still at its early stages. The short-term consolidation remains between 117 and 123 levels. The low for the year 2015 stands at 115 as an other important medium/long-term support level. The latest chart development suggests that in the short/medium-term bonds might be finding support. Price should either break 117 levels on the downside or 123 levels on the upside for the chart pattern to complete.
ISHARES RUSSELL 2000 INDEX ETF (IWM [2])
iShares Russell 2000 Index Fund (the Fund) seeks investment results that correspond generally to the price and yield performance of the Russell 2000 Index (the Index). The Index measures the performances of the small capitalization sector of the United States equity market. The Index includes approximately 8% of the market capitalization of all publicly traded United States equity securities. One of the widely discussed index due to its year to date weakness was the RUSSELL 2000. It is important to note that the price action since the beginning of the year remains in a sideways consolidation between 133 and 139 levels. It could still be early to call for a top reversal without any breach on the major technical support levels. In fact the technical outlook suggests that the year-long uptrend is still intact holding well above the 2015 highs, the 200 day average and the year-long upward trend line.
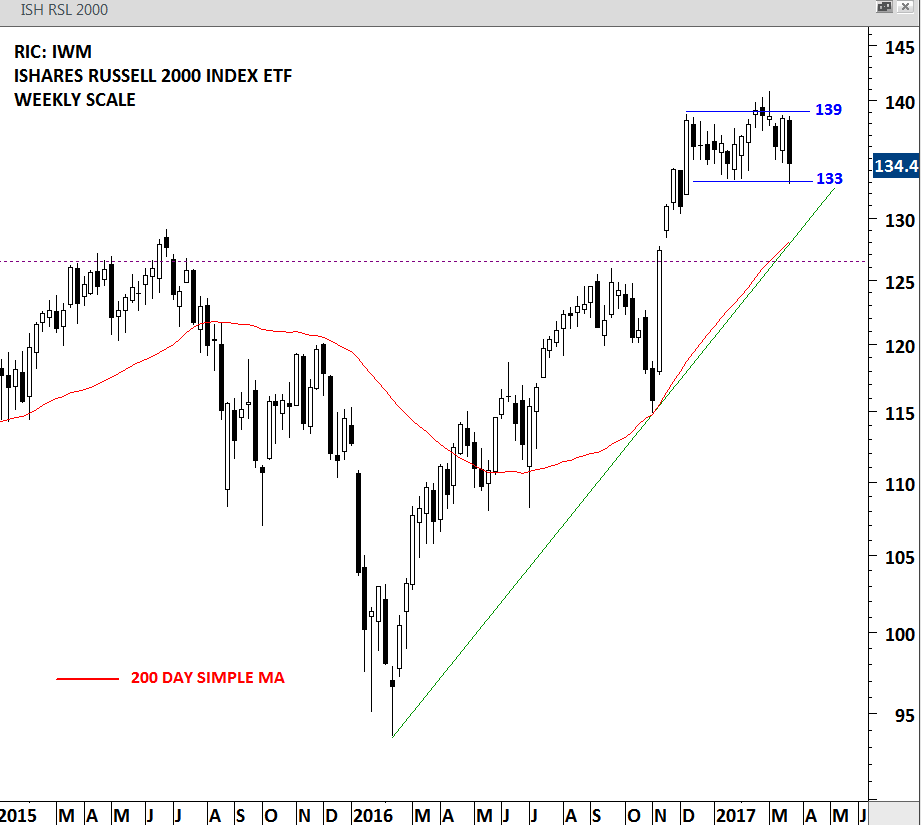
RUSSELL 2000 INDEX ETF – WEEKLY SCALE
ISHARES NIKKEI 225 INDEX ETF (1329.T [3])
There are several Japanese equity ETFs that track the MSCI JAPAN index but the ones that track the Nikkei 225 index are limited. Two of those that track Nikkei 225 index performance are IShares Nikkei 225 Index ETF (1329.T) and Nomura Nikkei 225 Index ETF (1321.T) that are listed on the Nikkei Stock Exchange. The chart below shows the Ishares Nikkei 225 Index ETF. Japan’s Nikkei 225 index was another widely discussed equity index during the past week. I review this index as both the Russell 2000 and the Nikkei 225 is forming a similar chart pattern in a tight range. Following the sharp rally that started in the last quarter of 2016, the Japanese index ETF is possibly consolidating those gains and trading range-bound between 19,260 and 20,160 levels. Before we see a breach of these two levels either on the upside or on the downside the technical outlook should be classified as neutral and the chart pattern development as a sideways consolidation.
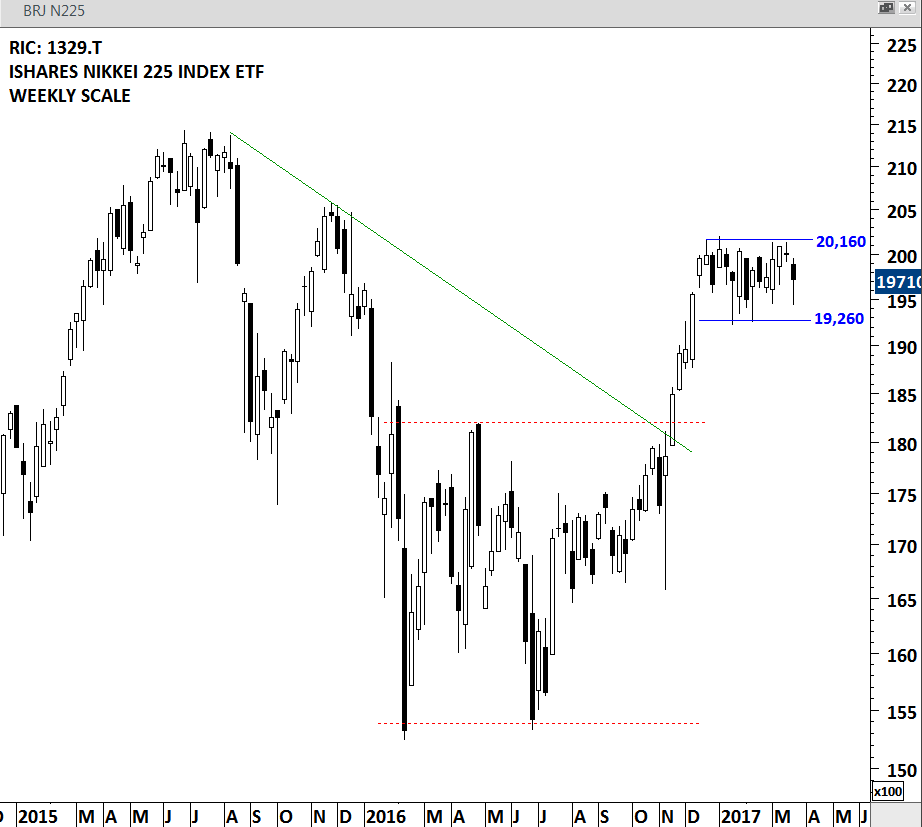
ISHARES N225 ETF – WEEKLY SCALE
#TECHCHARTSWATCHLIST [4]
I continue to review each chart on its own merit irrespective of the short-term fluctuations in the global equity indices. Below are some of the charts I added to the #TECHCHARTSWATCHLIST as possible breakout candidates. During the filtering and selection of the best chart pattern developments I try to bring to your attention those chart patterns with well-defined horizontal boundaries. I like to pick stocks that have tested the horizontal boundary several times before a decisive breakout takes place. The chart patterns that qualify are usually rectangles, ascending/descending triangles, H&S top/bottoms, cup&handle and H&S continuation chart patterns.
ALSTOM SA (ALSO.PA [5])
Alstom SA (Alstom) offers rail transport equipment, systems, services and signaling for urban, suburban, regional and main line passenger transportation, as well as for freight transportation. The Company’s portfolio includes trains, signaling solutions, integrated systems (including infrastructure) and services. The stock is listed on the Paris Stock Exchange. Price chart formed a 4 month-long rectangle with the strong horizontal boundary standing at 27.25 levels. Last 4 month’s consolidation has been between 25 and 27.25 levels. The upper boundary has been tested for 4 times over the course of the chart pattern. A daily close above 27.75 levels will confirm the breakout from the bullish continuation chart pattern with a possible price target of 29.5 levels.
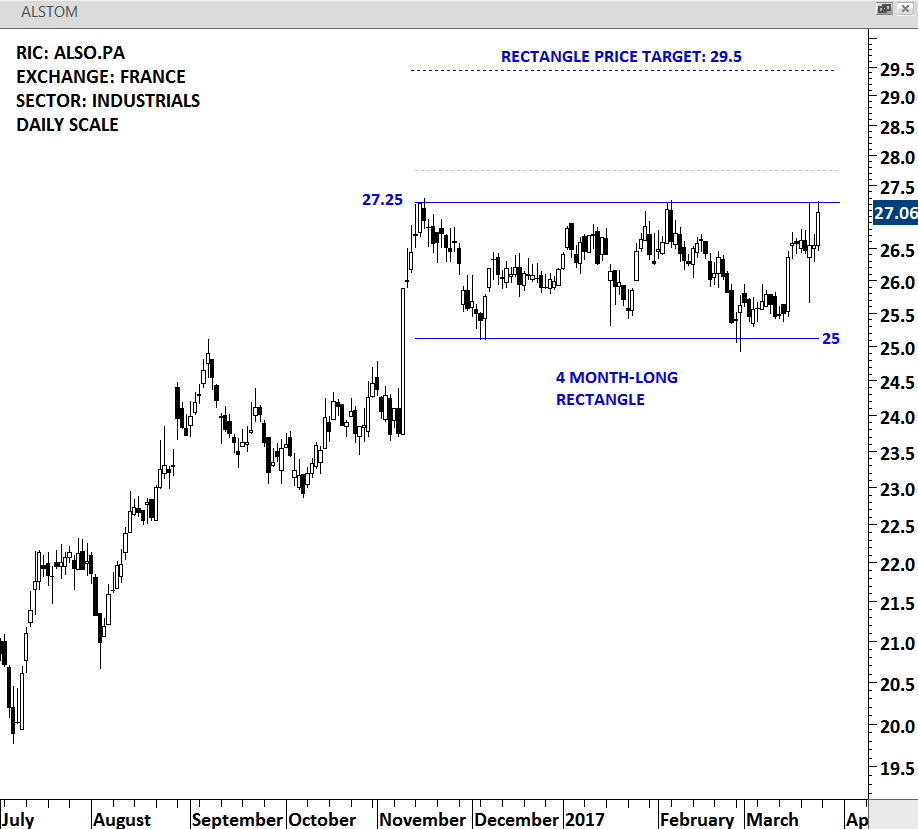
ALSTOM – DAILY SCALE
TOMTOM NV (TOM2.AS [6])
TomTom NV is a supplier of navigation systems, fleet management solutions and other related products that is based in the Netherlands. The stock is listed on the Amsterdam Stock Exchange. Price chart formed a 15 month-long H&S bottom with the strong horizontal resistance standing at 9 levels. The horizontal boundary has been tested for 4 times over the course of the chart pattern development. A daily close above 9.25 levels will confirm the breakout from the multi-month bullish reversal chart pattern with a possible price target of 11.5 levels.
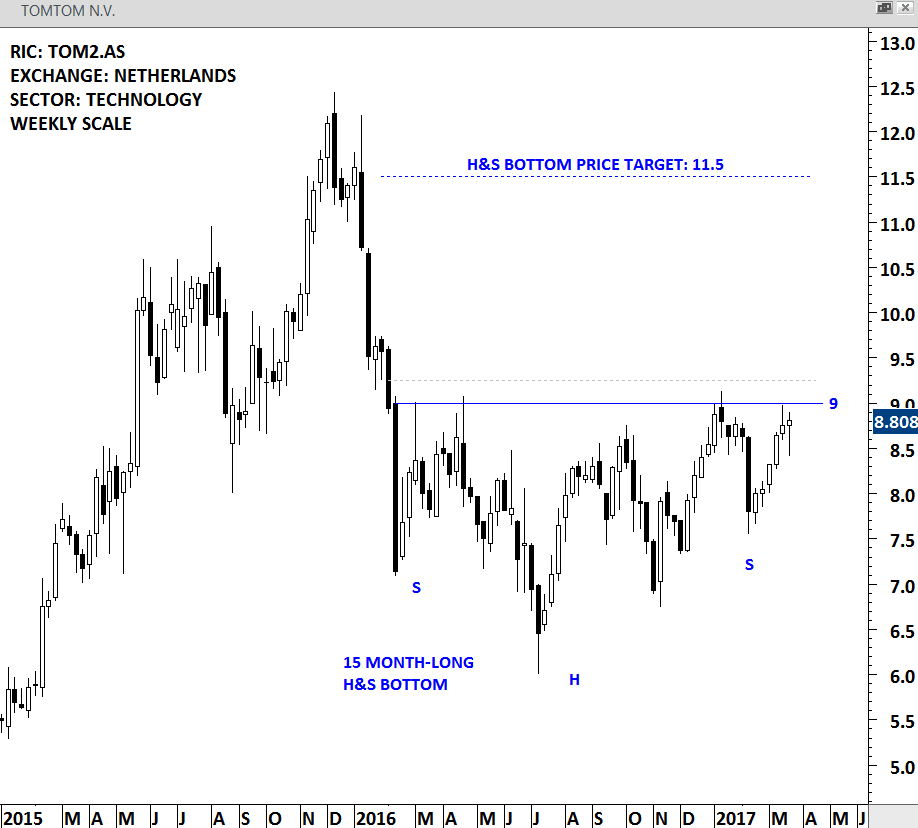
TOMTOM – WEEKLY SCALE
VARONIS SYSTEMS (VRNS.O [7])
Varonis Systems, Inc. provides a solutions that protect data from insider threats and cyberattacks. The stock is listed on the Nasdaq Stock Exchange. Price chart formed a 6 month-long rectangle continuation with the strong horizontal resistance standing at 31.15 levels. The upper boundary has been tested for 4 times over the past six months. A daily close above 32.10 levels will confirm the breakout from the bullish continuation chart pattern with a possible price target of 38 levels.
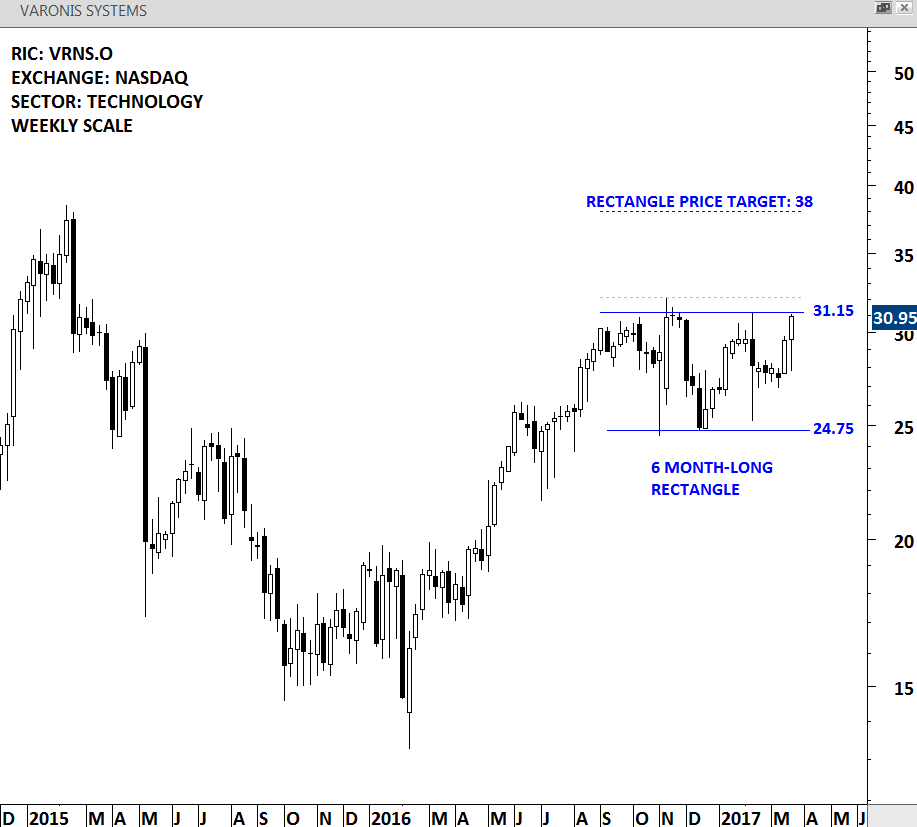
VARONIS SYSTEMS – WEEKLY SCALE
MYERS INDUSTRIES (MYE [8])
Myers Industries, Inc. is an international manufacturing and distribution company. The stock is listed on the New York Stock Exchange. Price chart formed a possible multi-month base formation in the form of an ascending triangle. Even though ascending triangle is classified as a continuation chart pattern, it can form as a reversal at major turning points. The horizontal boundary and the upward sloping trend line of the ascending triangle give the chart pattern its bullish characteristic. During the formation of the chart pattern a rising lower boundary and horizontal resistance suggests increasing buying power. A daily close above 16.15 levels will confirm the breakout from the multi-month base formation with a possible price target of 21 levels. The horizontal boundary has been tested for six times over the course of the chart pattern. A breakout can be powerful after several tests of the resistance area.
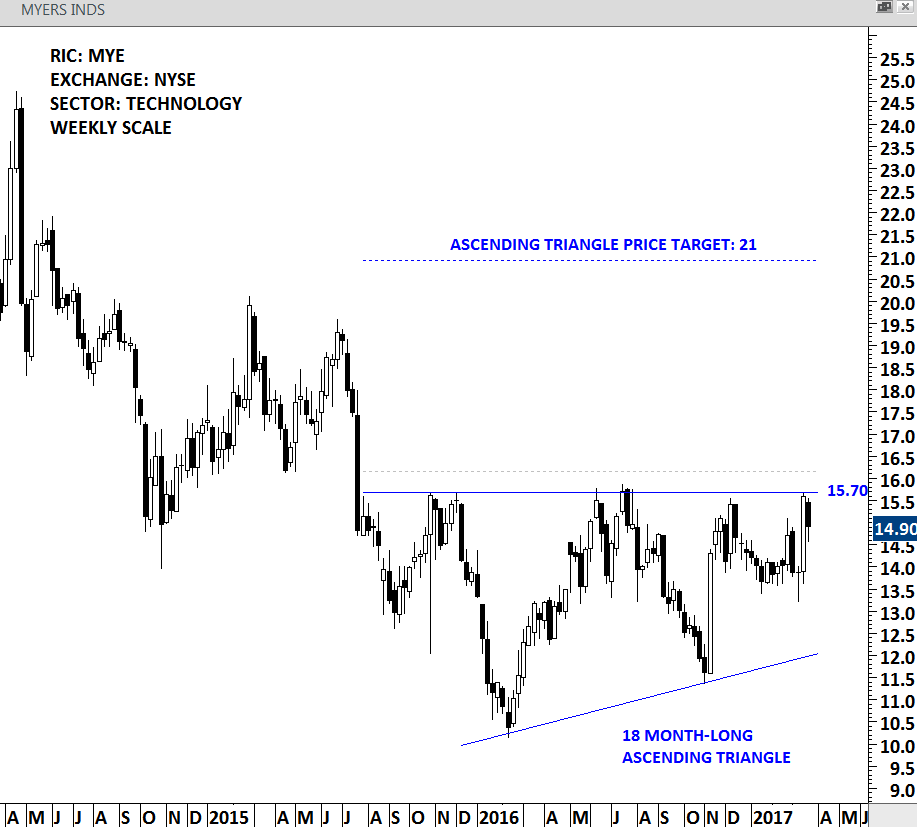
MYERS INDUSTRIES – WEEKLY SCALE
#TECHCHARTSALERT [9]
There has been two major breakouts in U.K. and Japan equities, completing multi-month rectangle chart patterns.
888 HOLDINGS (888.L [10])
888 Holdings Public Limited Company is a provider of online gaming entertainment and solutions. The company is listed on the London Stock Exchange. Price chart of 888 Holdings formed a year-long rectangle with the strong horizontal resistance at 235 levels. This week’s strong weekly close breached the horizontal resistance and generated a new chart pattern breakout signal. Edwards and Magee in their book Technical Analysis of Stock Trends suggest that a stock should breakout by a min 3% margin above the resistance for a clear chart pattern breakout signal. According to this guideline, a daily close above 240.65 confirmed the breakout. Possible chart pattern price target stands at 280 levels.
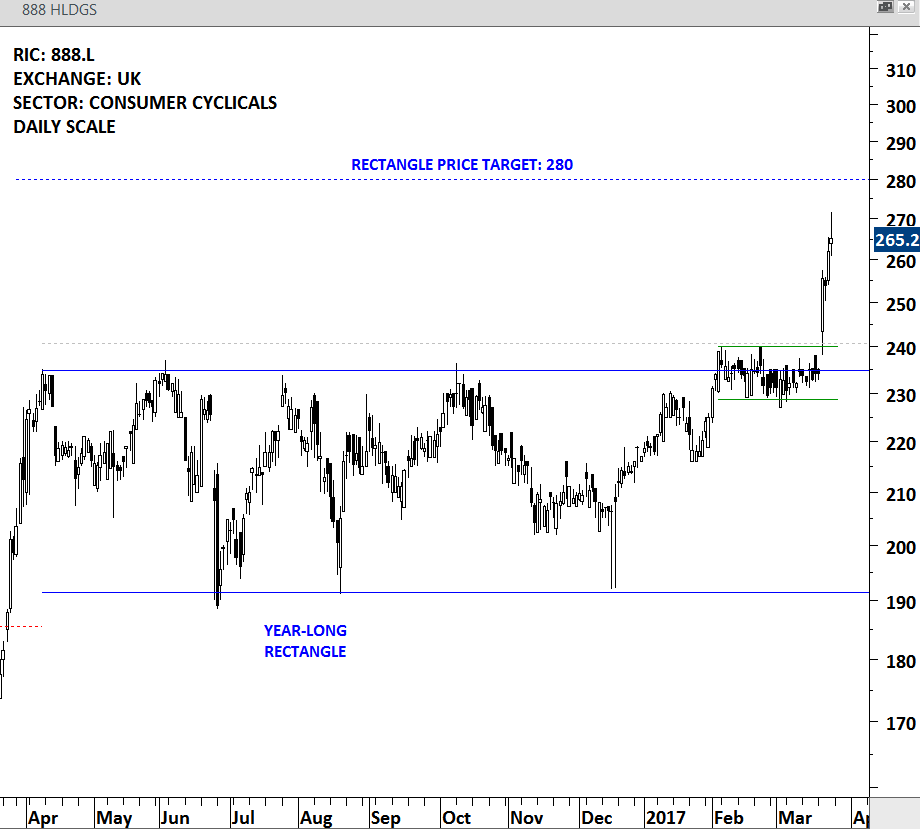
888 HOLDINGS – DAILY SCALE
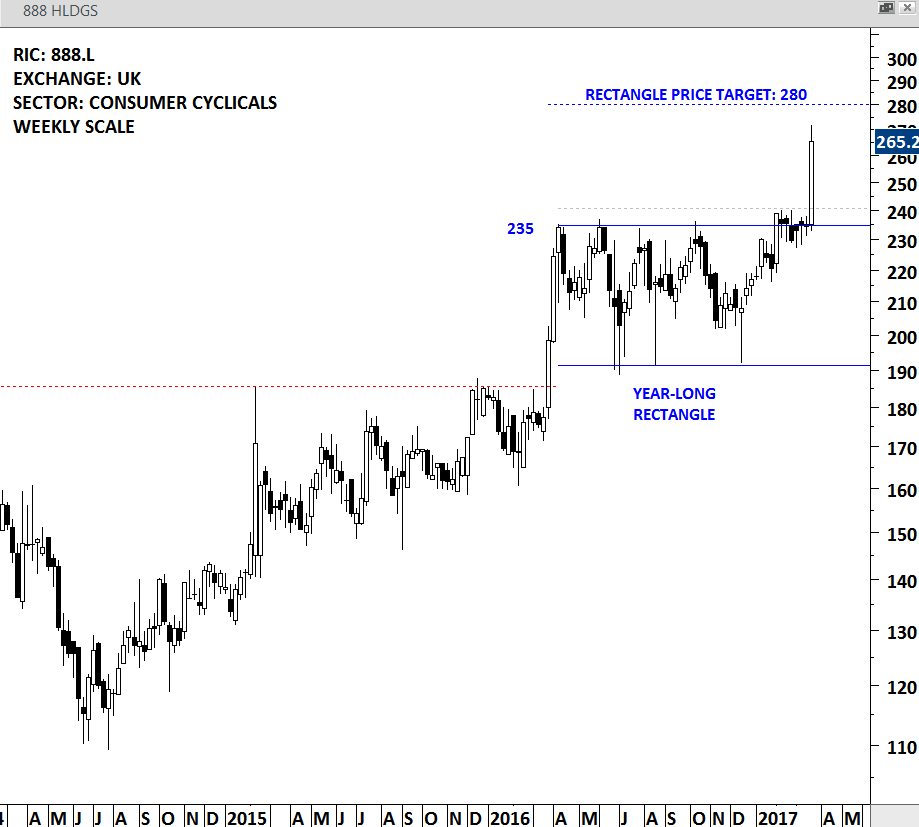
888 HOLDINGS – WEEKLY SCALE
MUGEN ESTATE (3299.T [11])
MUGEN ESTATE Co., Ltd. is engaged in the real estate related businesses through two business segments. The Real Estate Trading segment includes real estate purchase and resale, real estate interior and exterior work, as well as real estate transaction businesses. The Rental and Others segment involves real estate rental business, as well as real estate management business. The stock is listed on the Japan Stock Exchange. Price chart formed a 7 month-long rectangle that acted as a bottom reversal chart pattern. Daily close above 815 levels confirmed the breakout from the multi-month base formation with a possible price target of 950 levels. A new chart pattern breakout signal is generated for MUGEN ESTATE.
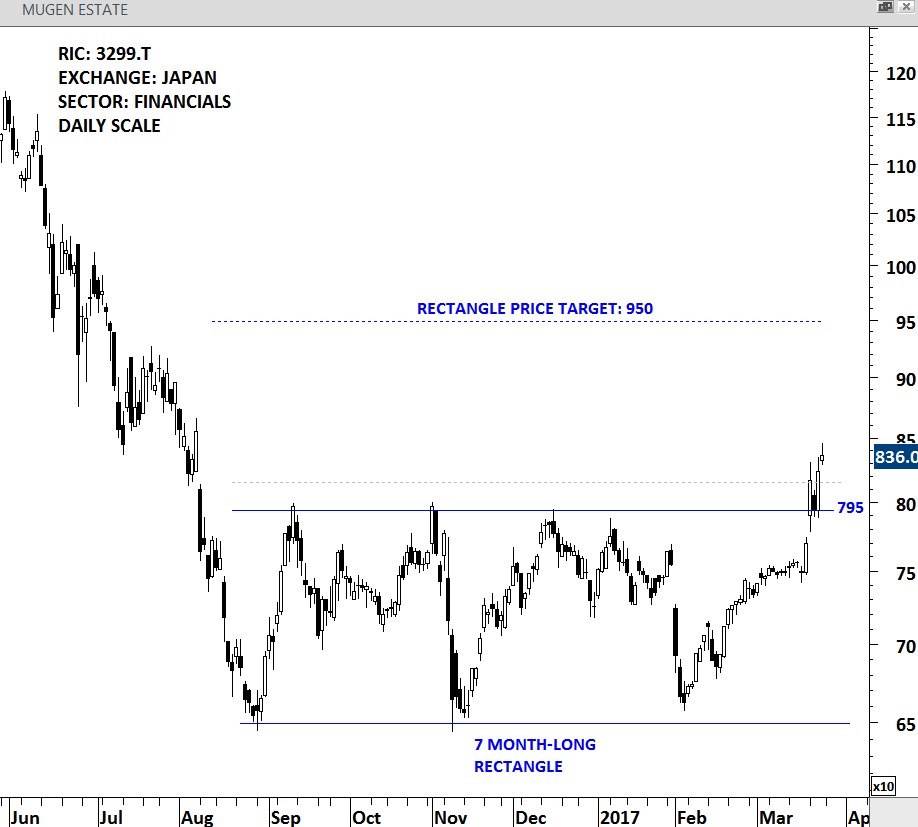
MUGEN ESTATE – DAILY SCALE
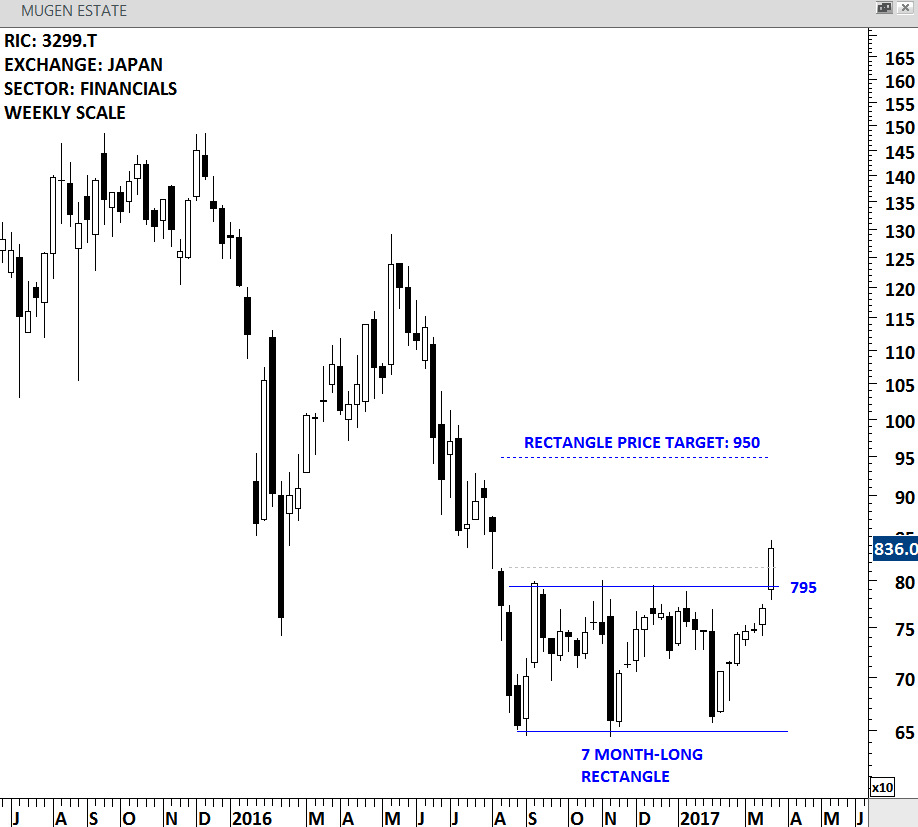
MUGEN ESTATE – WEEKLY SCALE