The MSCI Emerging Markets index is created by Morgan Stanley Capital International (MSCI) designed to measure equity market performance in global emerging markets. It is a float-adjusted market capitalization index that consists of indices in 23 emerging economies Brazil, Chile, China, Colombia, Czech Republic, Egypt, Greece, Hungary, India, Indonesia, Korea, Malaysia, Mexico, Peru, Philippines, Poland, Qatar, Russia, South Africa, Taiwan, Thailand, Turkey and United Arab Emirates.
Initiated in 1988, the MSCI Emerging Markets Index (MSCI EMI) represented 10 nations with a total world market capitalization of less than 1%. In 2016, the index has since grown to incorporate 23 countries that comprise about 10% of global market cap. Hence, the MSCI EMI is appropriately used as a benchmark for performance by many emerging market growth mutual funds.
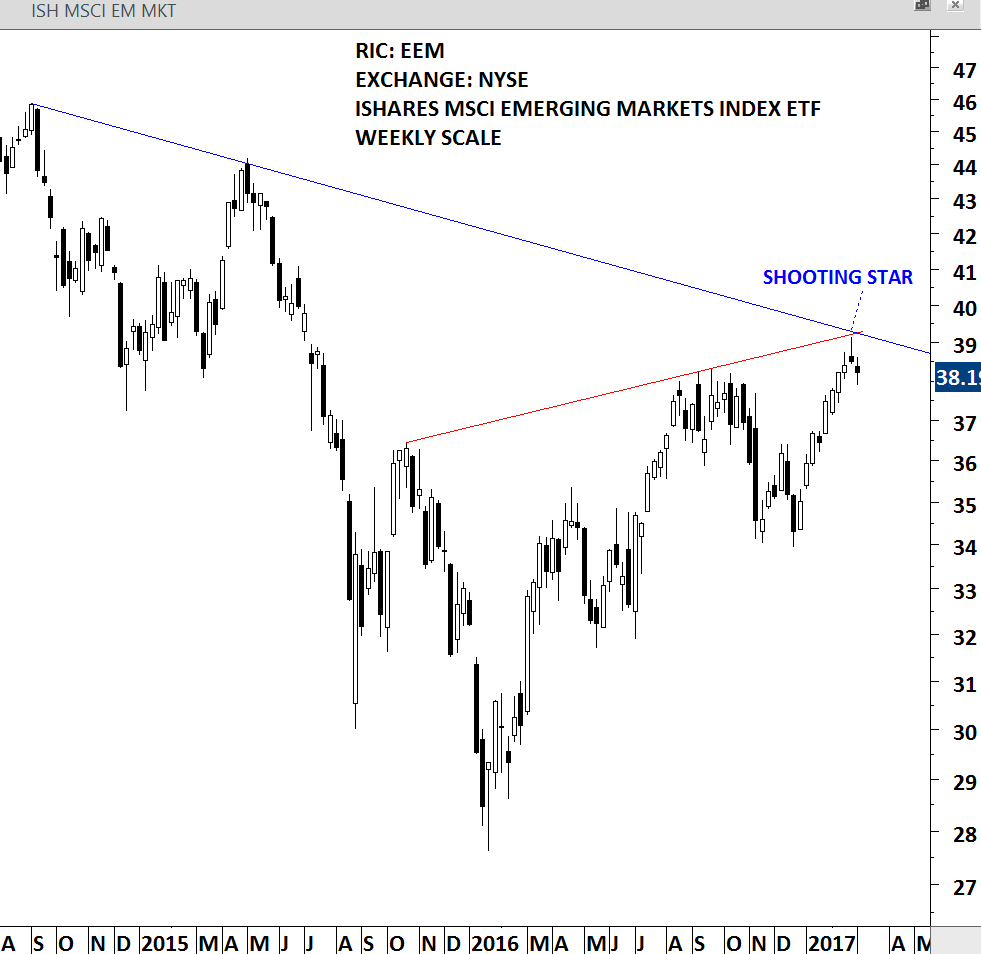
The iShares MSCI Emerging Markets ETF seeks to track the investment results of MSCI Emerging Markets Index. This ETF does not include any currency hedging. This means investors in this product gain exposure to the underlying securities and the currencies in which they are denominated. It is an efficient way to take advantage of trends in the emerging markets and cyclical movements related to emerging markets local currencies.
Last week’s update [1] drew attention to the developing bearish candlestick reversal pattern, a shooting star, usually suggests lower prices following its completion. This week’s lower opening and weak closing confirms the short-term pull-back in emerging markets equities.
 [2]
[2]ISHARES MSCI EMERGING MARKETS ETF – WEEKLY SCALE
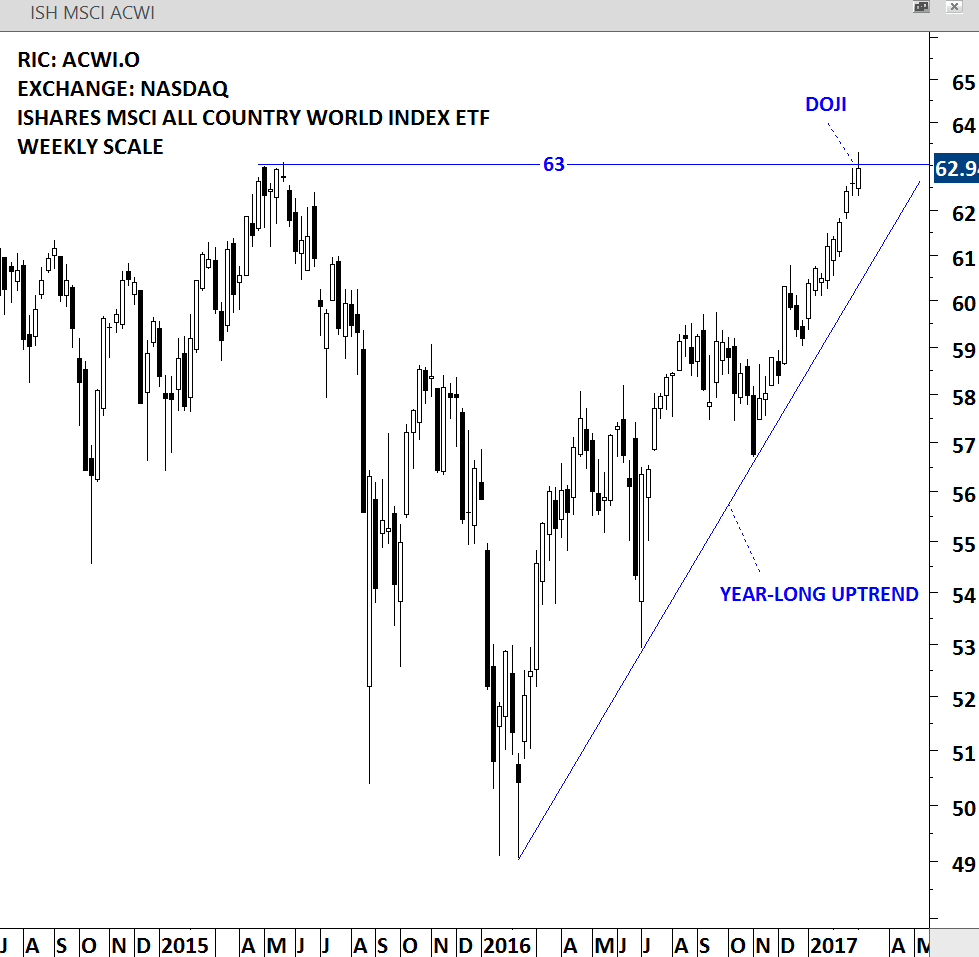
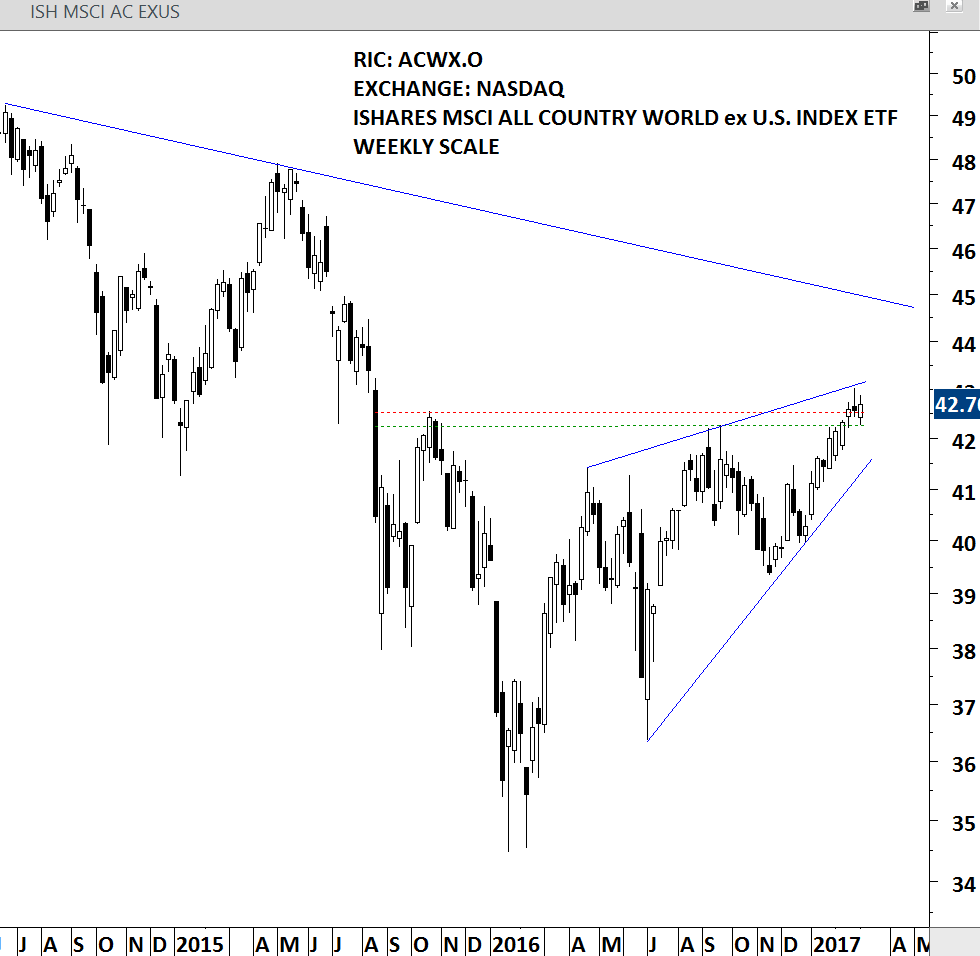
MSCI ACWI is a market capitalization weighted index designed to provide a broad measure of equity-market performance throughout the world. This index contains stocks from 46 different countries. There are 23 countries classified as developed markets and 23 countries considered emerging markets. Typically the index is built first at the country level, and then the 46 indexes are aggregated into the MSCI All Country World Index. A similar index exists that contains the same countries with the exception of the U.S. – the MSCI ACWI ex U.S. ISHARES MSCI ACWI and ISHARES MSCI ACWI ex US tracks the indices mentioned above. Last week’s Doji was formed at a critical resistance. This week’s price action was not negative but still respected the resistance at 63 levels. In the following weeks continuation of strength in global equities will depend on how this widely followed benchmark will cope with the strong resistance at 63 levels. This update features also the Ishares MSCI ACWI ex. US ETF.
 [3]
[3]ISHARES MSCI ACWI ETF – WEEKLY SCALE
 [4]
[4]ISHARES MSCI ACWI ex US ETF – WEEKLY SCALE
Following a strong uptrend, it is normal for the global equity indices to experience set backs. Especially when indices reach strong technical resistance levels. However, not all stocks will reverse and trend lower. There can still be several stocks that reach new all time highs or break out of lengthy consolidations. This can also be said for the country indices. It is those type of stocks or indices that one would like to be involved in. Stocks that hold well during market set backs and manage to trend higher, will emerge as market leaders once the momentum picks up. This week’s watchlist includes several breakout candidates in global equities.
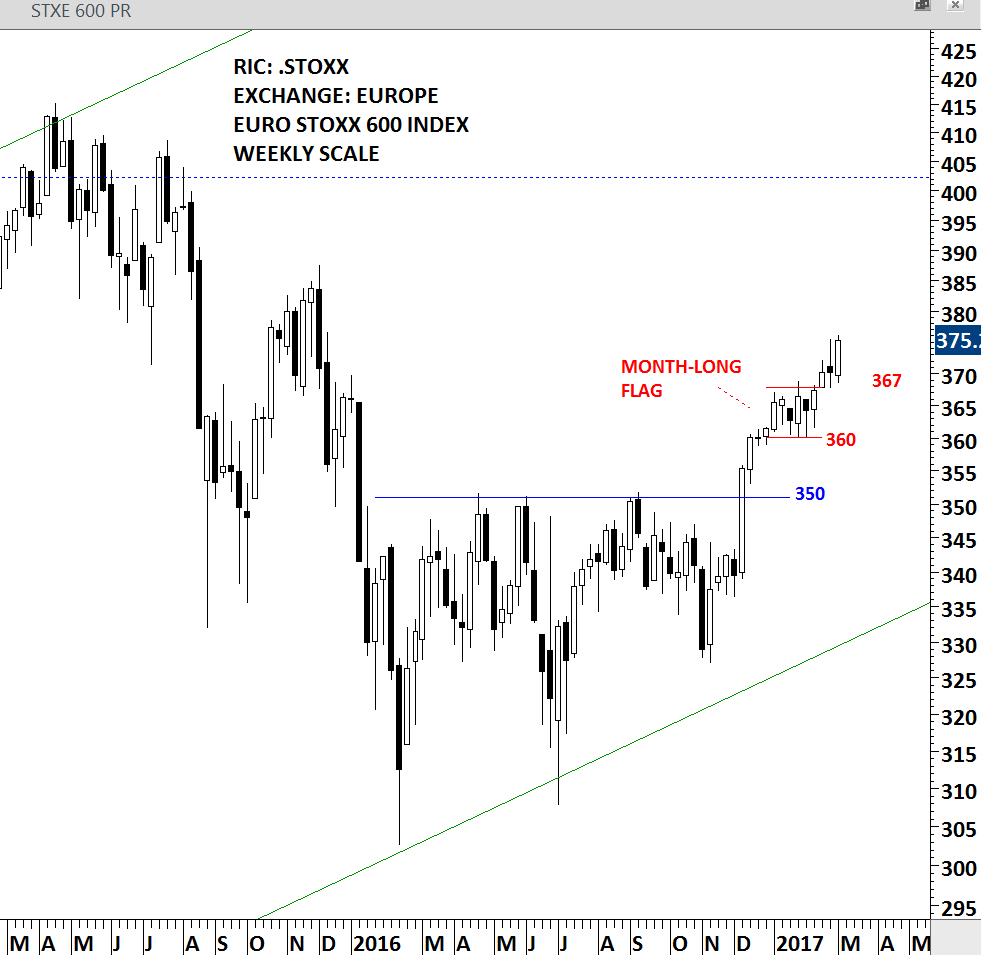
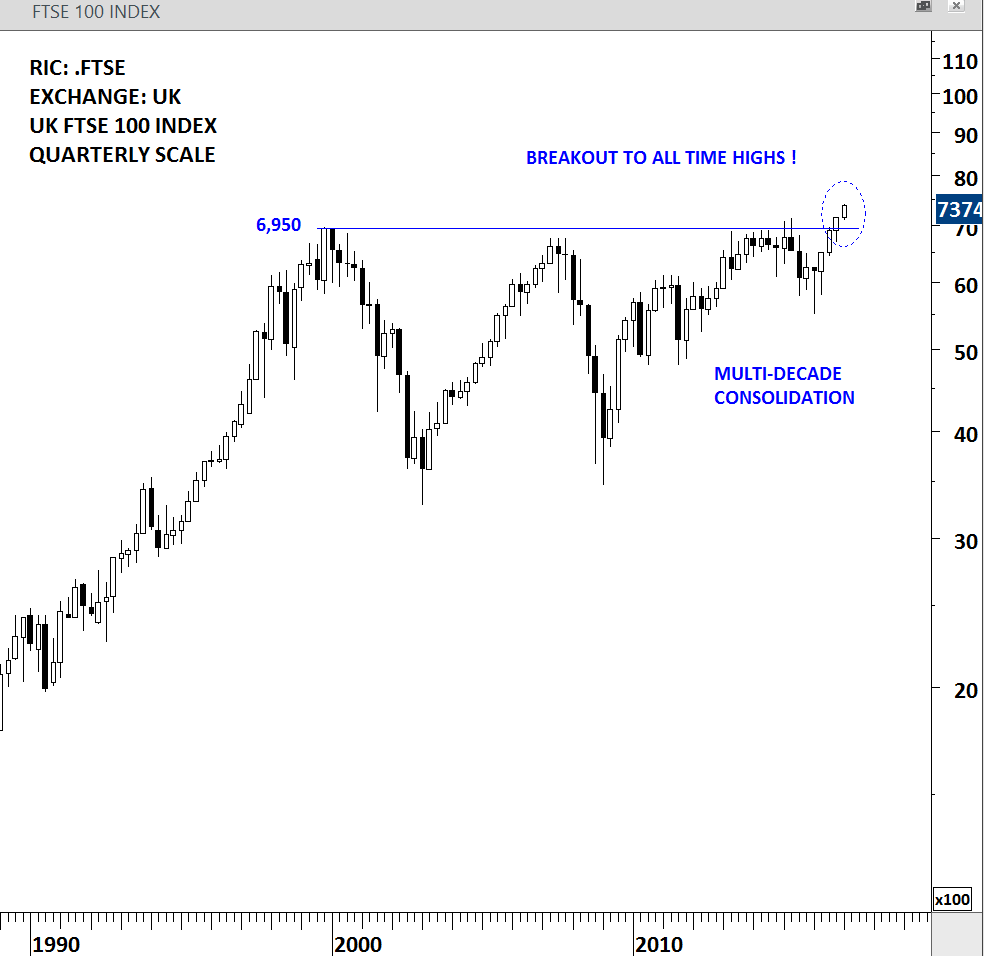
In Developed Markets, European equities are clearly showing strength with both EURO STOXX 600 and FTSE 100 recording strong weekly closes. Euro Stoxx 600 completed a month-long flag continuation chart pattern and it is now resuming the uptrend. One of the most positive technical development in the equity indices has been the long-term breakout on the FTSE 100 index to all-time high levels. Quarterly scale graph clearly shows the big picture and the significance of the latest breakout to all-time high levels.
 [5]
[5]EURO STOXX 600 – WEEKLY SCALE
 [6]
[6]FTSE 100 INDEX – QUARTERLY SCALE
It is important to note that weekly Global Equity Markets updates will also feature bearish chart developments as well as bullish set ups on stocks as they develop. These will be in the form of H&S tops, Double tops, Rectangle reversals, Descending triangles and rectangle continuation chart patterns in a downtrend. These type of alerts will most likely occur when most of the equity indices are in an established downtrend and most of the chart pattern completions are on the downside with major breakdowns.
This week 6 new charts were added to the #TECHCHARTSWATCHLIST.
#TECHCHARTSWATCHLIST [7]
PARGESA HOLDING (PARG.S [8])
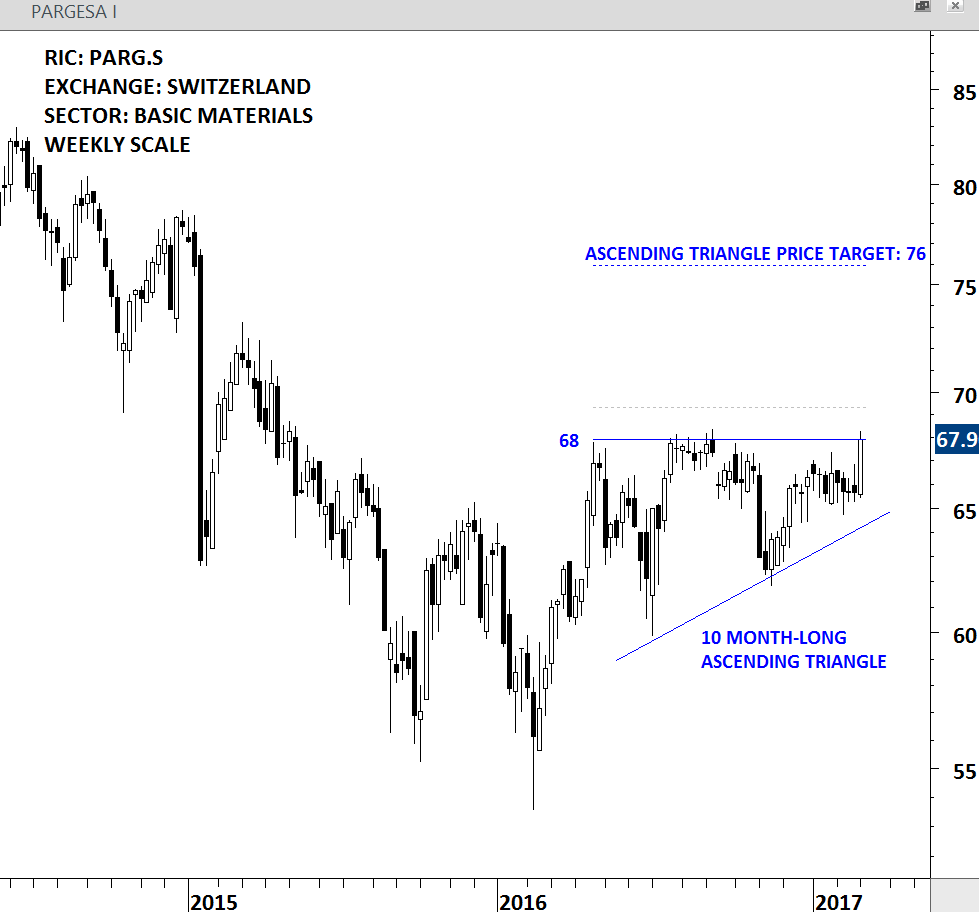
Pargesa Holding SA is a Switzerland-based investment holding company engaged in various industry and services sectors, through its holdings in a number of operating companies. The stock is listed on the Swiss Stock Exchange. Price chart of Pargesa Holding formed a 10 month-long ascending triangle with the horizontal boundary standing at 68 levels. Ascending triangle is a bullish chart pattern that can act as reversal as well as continuation. A daily close above 69.35 levels will confirm the breakout from the multi-month bullish chart pattern with a possible price target of 76.
 [9]
[9]PARGESA HOLDING – WEEKLY SCALE
XING AG (OBCGn.DE [10])
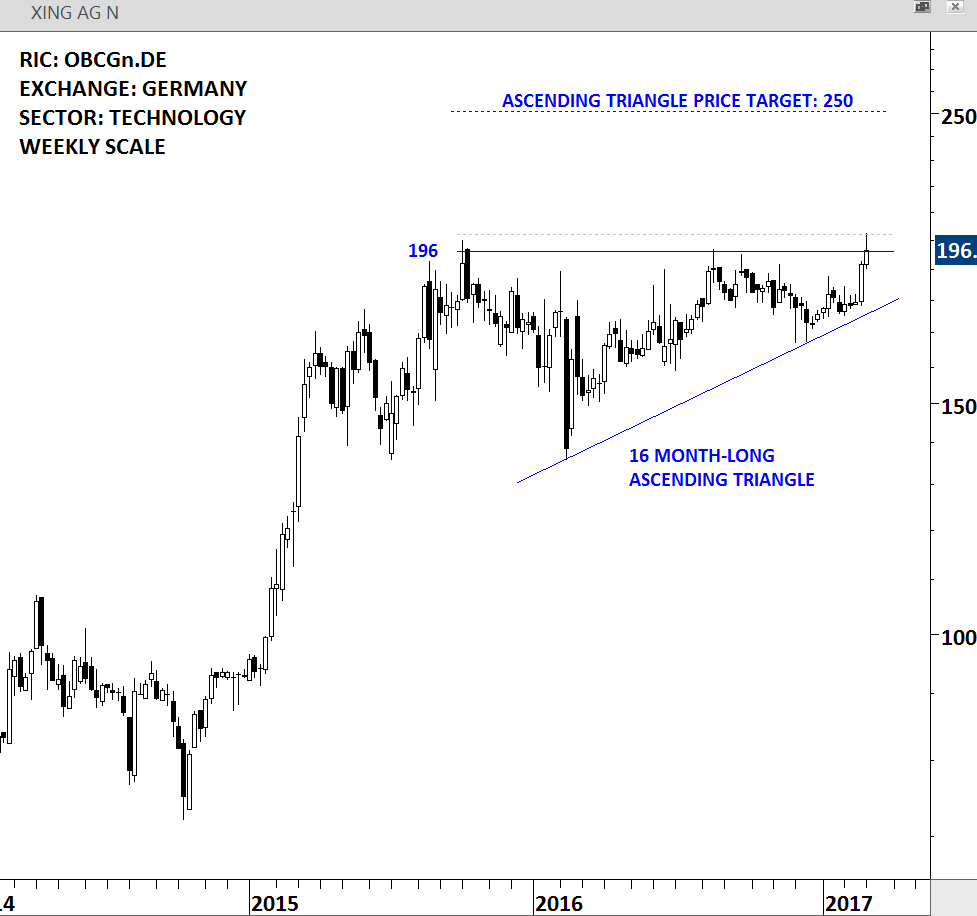
Xing AG is a Germany-based operator of a social network for business professionals in German-speaking countries. The platform, XING, allows professionals from all kinds of different industries to meet up, find jobs, colleagues, new assignments, cooperation partners, experts and generate business ideas. The stock is listed on Germany XETRA DAX. Price chart of Xing AG formed a 16 month-long ascending triangle with the strong horizontal boundary standing at 196 levels. This week’s close was at the pattern boundary. Xing AG is trying to breakout to all-time high levels. A daily close above 202 levels will confirm the breakout from the multi-month bullish continuation chart pattern with a possible price target of 250.
 [11]
[11]XING AG – WEEKLY SCALE
ISELECT LTD. (ISU.AX [12])
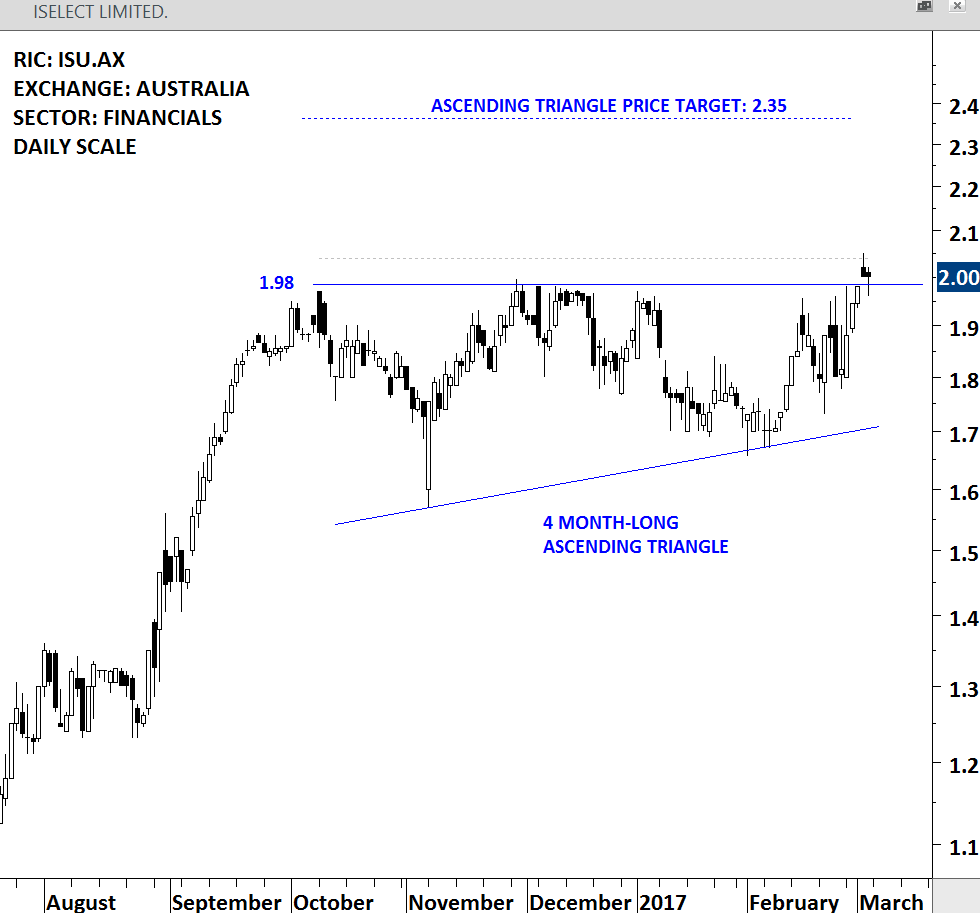
iSelect Limited operates in the online product comparison sector. The Company’s principal activities include health, life and car insurance policy sales, mortgage brokerage, energy, broadband and financial referral services. The stock is listed on the Australia Stock Exchange. Price chart formed a 4 month-long ascending triangle with the strong horizontal resistance at 1.98 levels. Edwards and Magee in their book Technical Analysis of Stock Trends suggest that a stock should breakout by a min 3% margin above the resistance for a clear chart pattern breakout signal. According to this guideline, a daily close above 2.04 levels will confirm the breakout from the 4 month-long ascending triangle. Possible chart pattern price target stands at 2.35 levels.
 [13]
[13]ISELECT LIMITED – DAILY SCALE
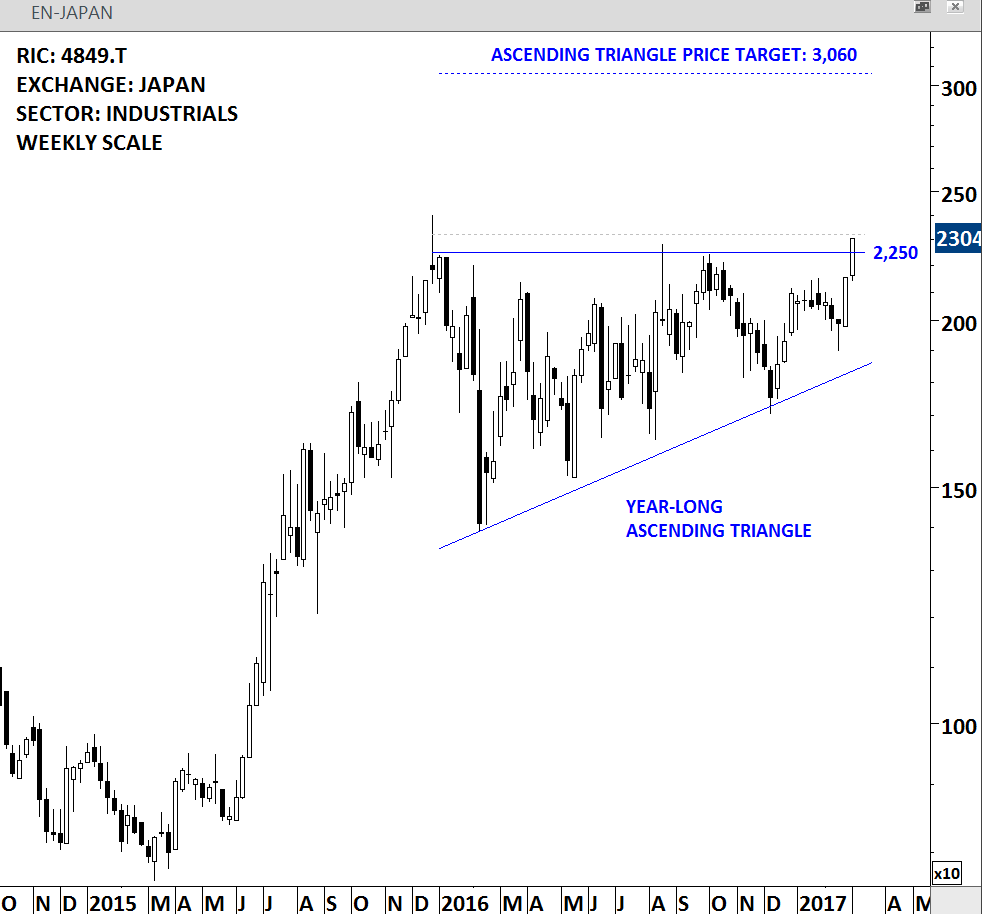
EN-JAPAN INC (4849.T [14])
En-Japan inc. is primarily engaged in online job information business. Stock is listed on the Tokyo Stock Exchange. Price chart formed a year-long bullish ascending triangle chart pattern. This chart pattern can also be identified as a symmetrical triangle. Both interpretations suggest higher levels. If we try to connect as many high levels as possible and draw a horizontal boundary it would be at 2,250 levels. This week’s close was at 2,304 levels. A daily close above 2,320 levels will confirm the breakout from the multi-month chart pattern with a possible price target of 3,060.
 [15]
[15]EN JAPAN – WEEKLY SCALE
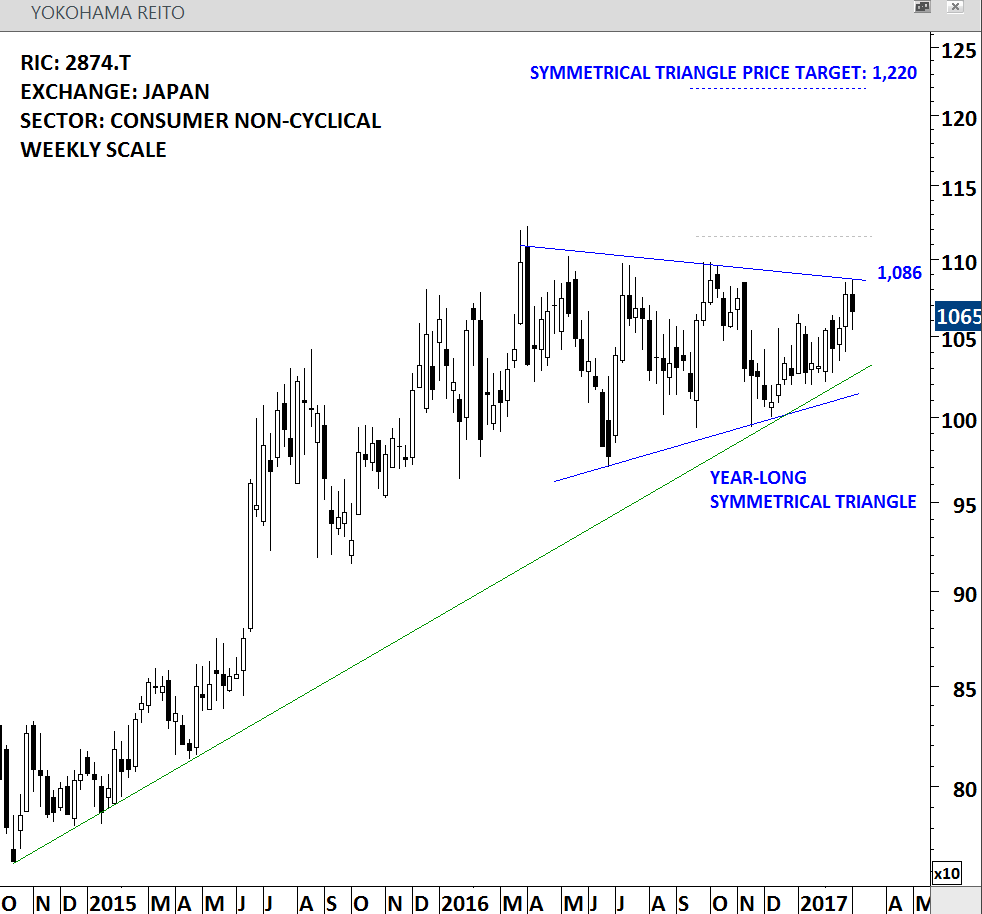
YOKOHAMA REITO (2874.T [16])
YOKOHAMA REITO CO., LTD. is a Japan-based company mainly engaged in the refrigerated warehouse business and the food sales business. The stock is listed on the Tokyo Stock Exchange. Price chart formed a year-long symmetrical triangle with the upper boundary standing at 1,086 levels. Symmetrical triangles can act as a continuation chart pattern as well as a reversal. It is always important to wait for a confirmation with a decisive breakout and with symmetrical triangles it is even more important to wait for the confirmation. A daily close above 1,115 levels will clear the pattern boundary by a 3% margin and will confirm the breakout with a possible chart pattern price target of 1,220.
 [17]
[17]YOKOHAMA REITO – WEEKLY SCALE
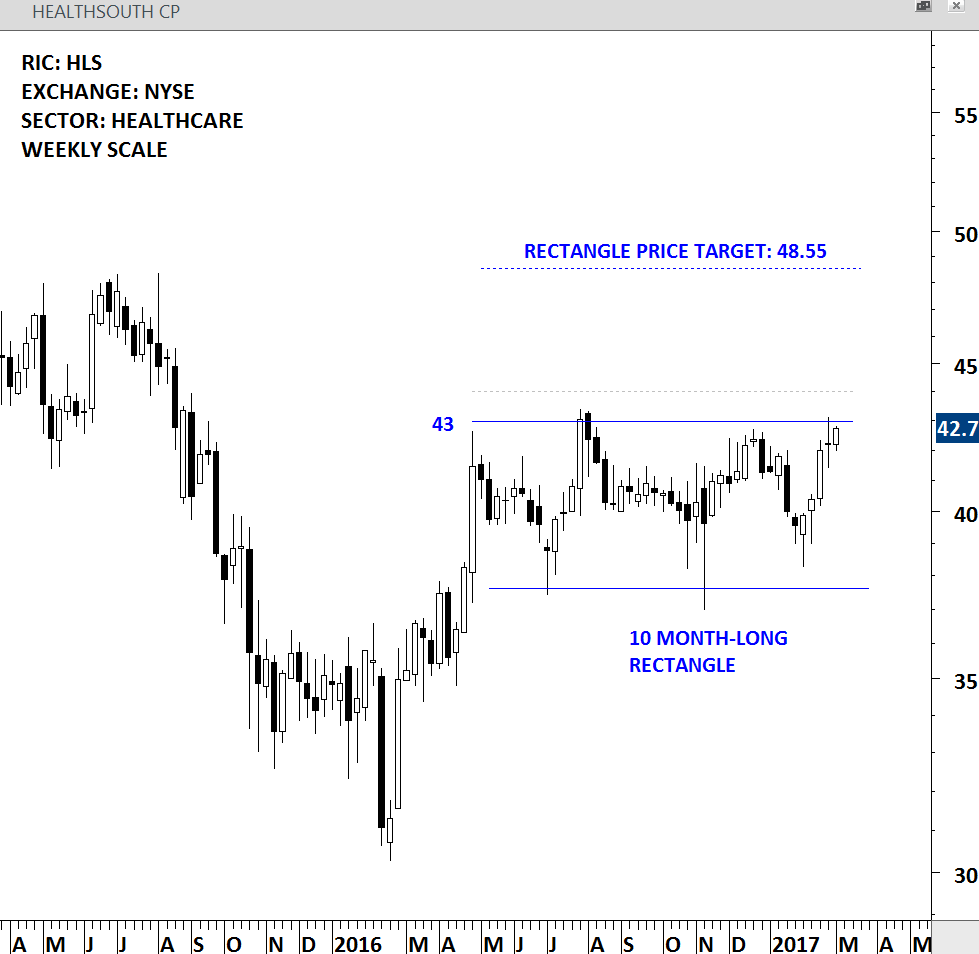
HEALTH SOUTH CORP (HLS [18])
Health South Corporation is a provider of post acute healthcare services, offering both facility based and home-based post acute services in over 30 states and Puerto Rico through its network of inpatient rehabilitation hospitals, home health agencies and hospice agencies. The stock is listed on the New York Stock Exchange. Price chart formed a 10 month-long rectangle with the strong horizontal boundary standing at 43 levels. Rectangles are usually continuation chart patterns. A daily close above 44 levels will confirm the breakout with a possible price target of 48.55 levels.
 [19]
[19]HEALTH SOUTH CORP – WEEKLY SCALE
This week there were 2 new chart pattern breakout signals.
#TECHCHARTSALERT [20]
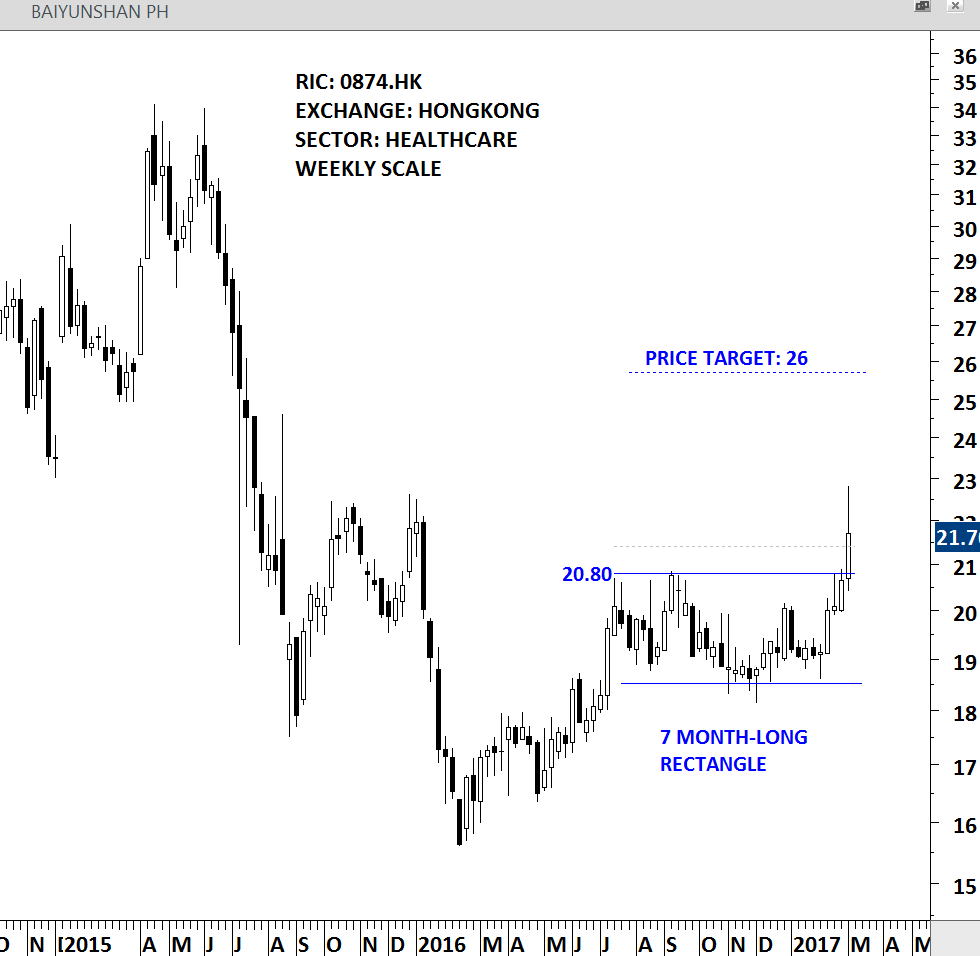
BAIYUNSHAN PHARMACEUTICALS HOLDINGS CO. (0874.HK [21])
Baiyunshan Pharmaceutical Holdings Company Limited is engaged in the pharmaceutical and healthcare industry. The stock is listed on the Hong Kong Stock Exchange. Price chart formed a 7 month-long rectangle with the strong horizontal resistance standing at 20.80 levels. The daily close above 21.40 levels confirmed the breakout from the multi-month consolidation and a new chart pattern breakout signal is triggered. Even though the weekly close was off its highs this is still considered strong price action. While the rectangle chart pattern price target stands at 23.5 levels, this breakout could be the beginning of a larger scale trend that can push prices towards 26 levels.
 [22]
[22]BAIYUNSHAN PHARMA – WEEKLY SCALE
APOLLO INVESTMENT CORP (AINV.O [23])
Apollo Investment Corporation is a closed-end, externally managed, non-diversified management investment company. It is listed on the Nasdaq Stock Exchange. Price chart formed a 4 month-long ascending triangle with the upper boundary standing at 6.25 levels. The daily close above 6.40 levels confirmed the breakout from the bullish continuation chart pattern with a possible chart pattern price target of 6.90 levels.
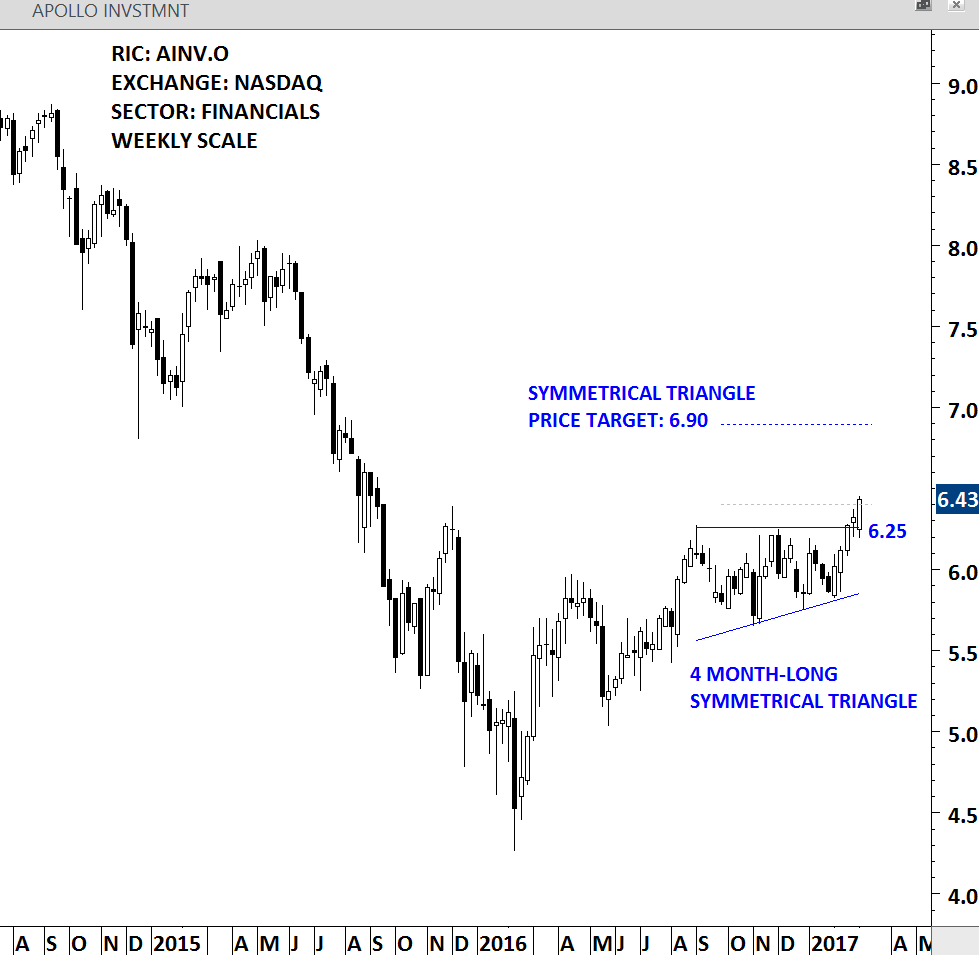 [24]
[24]APOLLO INV – WEEKLY SCALE