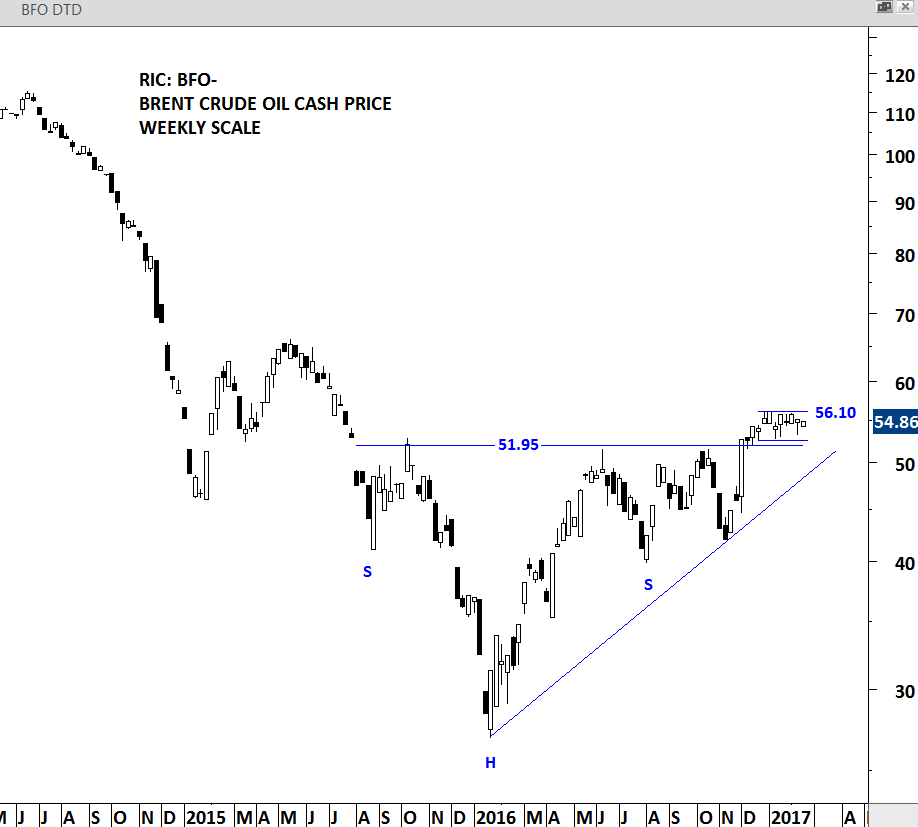
Energy prices are due for a strong directional movement after volatility reached extreme low levels. 2 month-long tight consolidation should end soon, possibly resulting in a sharp price movement. After breaking above 51.95 resistance, Brent Crude Oil entered in to a short-term sideways consolidation. Last 2 month’s price action remained range bound between 52.50 and 56.10. Breakout above 56.10 will add further momentum to Brent Crude oil prices that are already in a uptrend for the past year.
 [1]
[1]BRENT CRUDE OIL – WEEKLY SCALE
#TECHCHARTSWATCHLIST [2]
U.S. BRENT CRUDE OIL FUND (BNO [3])
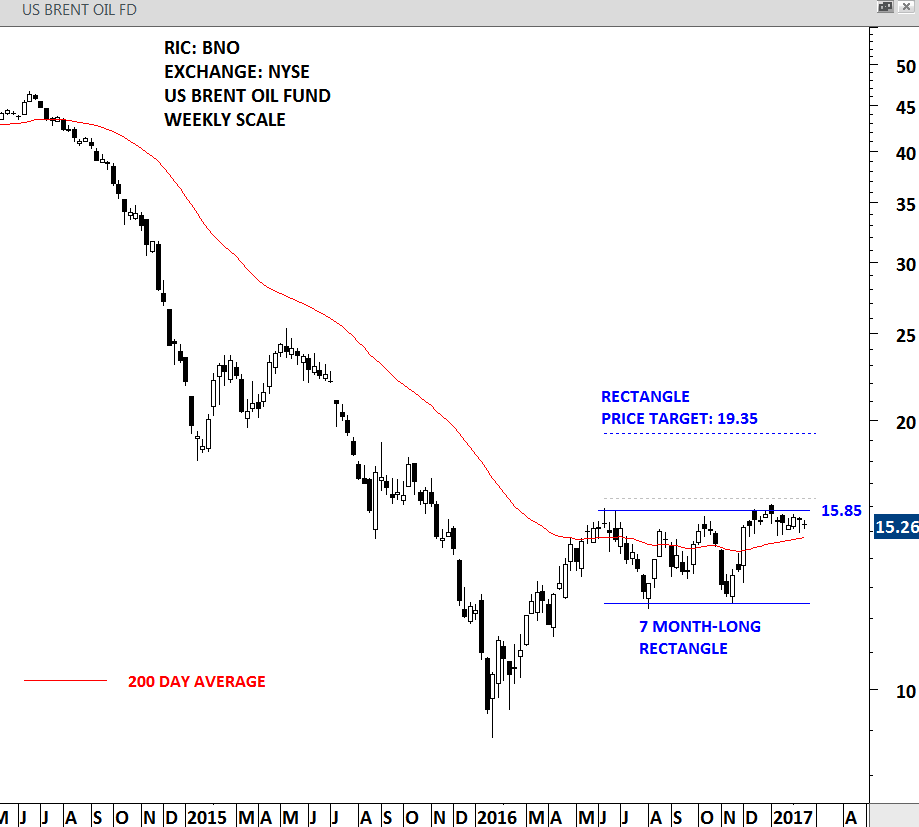
Equity traders can look at U.S. Brent Crude Oil Fund (BNO) listed on the NYSE. The Fund seeks the daily changes in percentage terms of net asset value to reflect the daily changes in percentage terms of the spot price of Brent crude oil as measured by the changes in the price of the futures contract on Brent crude oil. Brent Crude Oil is a light crude oil that is ideal for production of gasoline. Price chart of BNO formed a 7 month-long rectangle with the strong resistance standing at 15.85 levels. A daily close above 16.35 levels will confirm the breakout from the continuation chart pattern. Possible price target for the rectangle stands at 19.35 levels.
 [4]
[4]BNO – WEEKLY SCALE
ISHARES S&P GSCI COMMODITY INDEX (GSG [5])
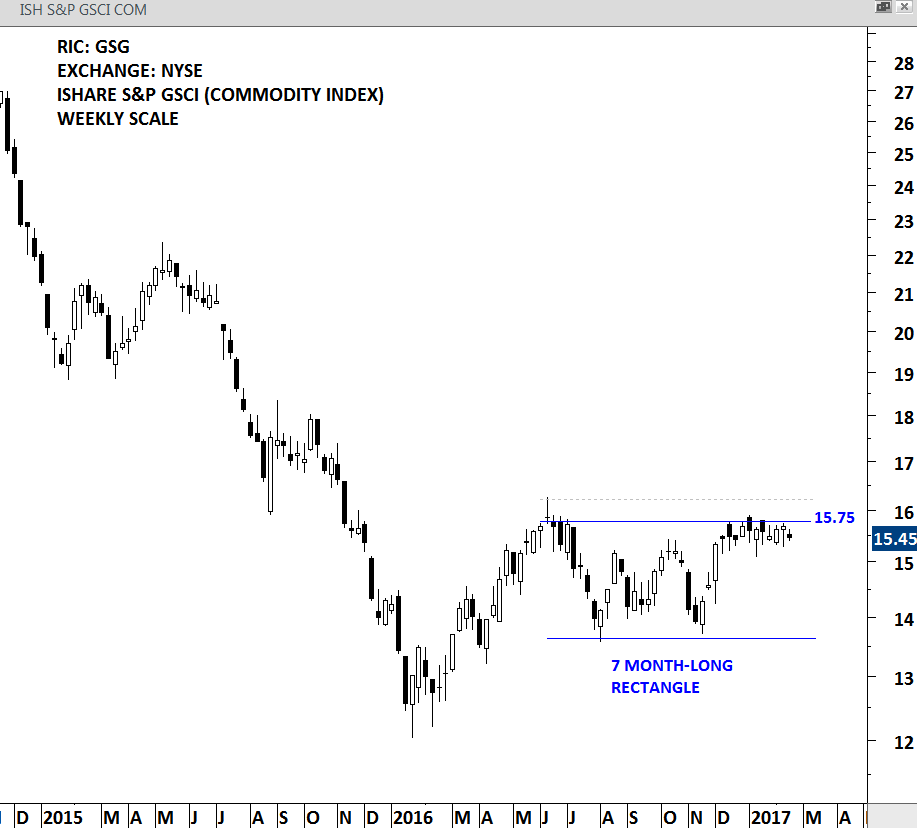
Another similar rectangle chart pattern is developing on the iShares S&P GSCI (Commodity Index). Similarity of the chart patterns can be due to the weight of the energy component in the S&P GSCI. The commodity ETF (GSG) is liquid and should be an efficient way to take advantage of a possible breakout in the commodities. Tight consolidation between 15 and 15.95 should end soon resulting in a directional move for the commodity index. Strong horizontal resistance stands at 15.75 levels. A daily close above 16.25 will confirm the breakout from the 7 month-long rectangle chart pattern.
 [6]
[6]ISHARES S&P GSCI – WEEKLY SCALE
TASER INTERNATIONAL INC. (TASR.O [7])
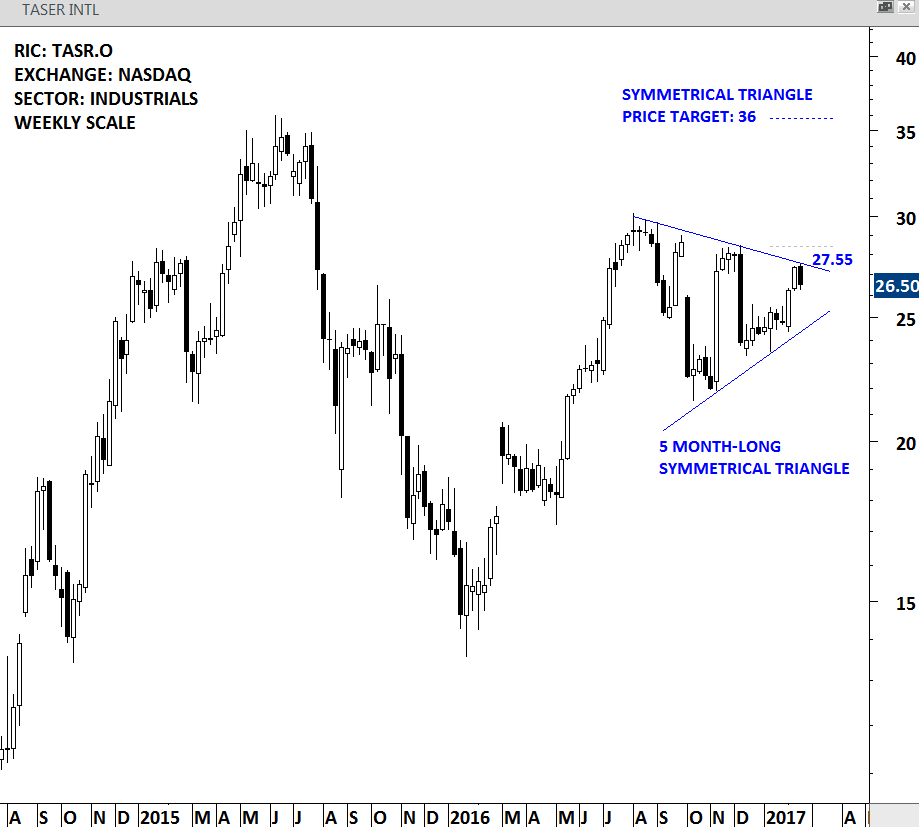
TASER International, Inc. is engaged in development, manufacture and sale of conducted electrical weapons (CEWs) designed for use by law enforcement, military, corrections and private security personnel, and by private individuals for personal defense. The Company is also engaged in development of connected wearable on-officer cameras, which utilize its cloud-based digital evidence management solution (Axon solution). TASER is listed on the Nasdaq Stock Exchange. Price chart formed a 5 month-long symmetrical triangle. The upper boundary is acting as resistance at 27.55 levels. A daily close above 28.40 levels will confirm the breakout from the symmetrical triangle with a possible price target of 36 levels. Symmetrical triangles can be identified as continuation as well as reversal chart patterns. For this reason a decisive breakout becomes more important before committing any capital.
 [8]
[8]TASER INTL – WEEKLY SCALE
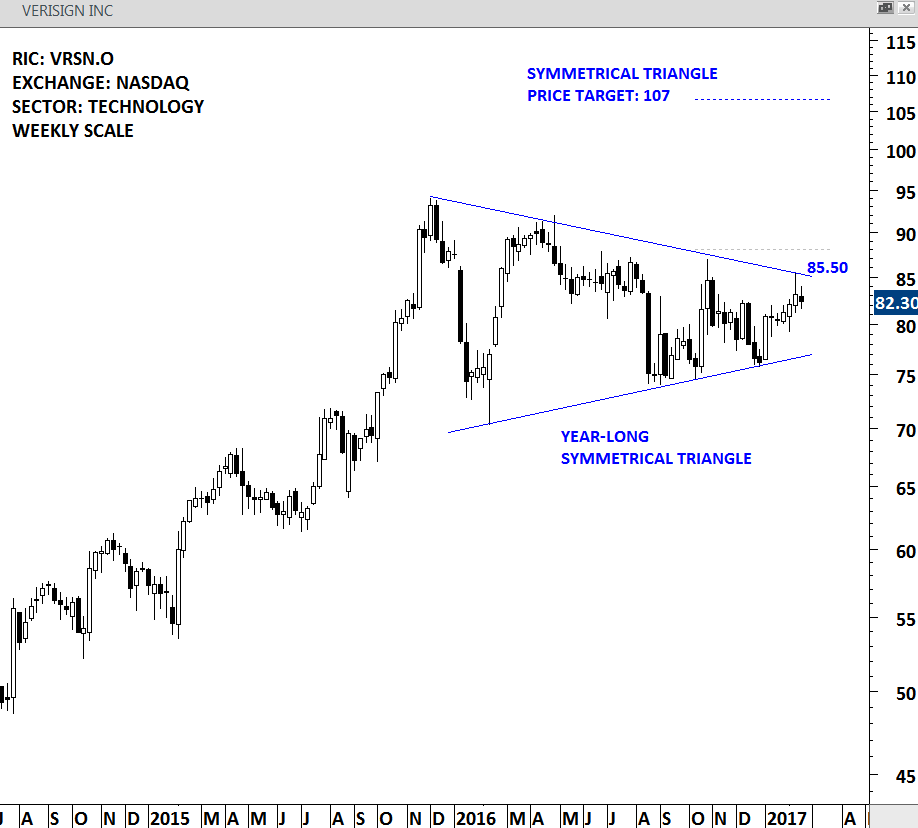
VERISIGN INC. (VRSN.O [9])
VeriSign, Inc. is a provider of domain name registry services and Internet security, enabling Internet navigation for domain names and providing protection for Websites and enterprises around the world (Registry Services). Stock is listed on the Nasdaq Stock Exchange. Price chart of VERISIGN formed a year-long symmetrical triangle. The upper boundary of the sideways consolidation is now acting as resistance at 85.50 levels. A daily close above 88 levels will confirm the breakout from the symmetrical triangle with a possible price target of 107 levels.
 [10]
[10]VERISIGN – WEEKLY SCALE
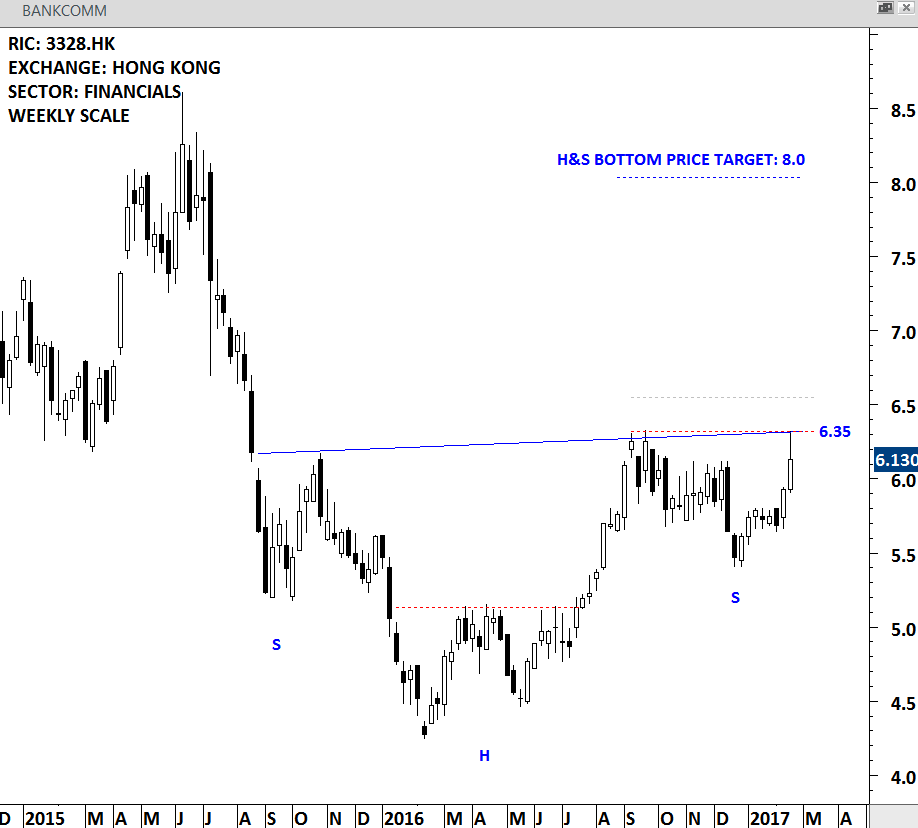
BANK OF COMMUNICATIONS CO. (3328.HK [11])
Bank of Communications Co., Ltd. is mainly engaged in banking and related financial services. Stock is listed on the Hong Kong stock exchange. Price chart formed a multi-month long H&S bottom that can act as a major base reversal. Past few week’s updates drew attention to the developing bullish chart patterns in Hong Kong/China financial sector stocks. Bank of Communications is another financial stock with a bullish technical outlook. Neckline of the H&S bottom stands at 6.35 levels. A daily close above 6.55 will confirm the breakout from the multi-month base formation with a possible price target of 8.0 levels.
 [12]
[12]BANKCOMM – WEEKLY SCALE
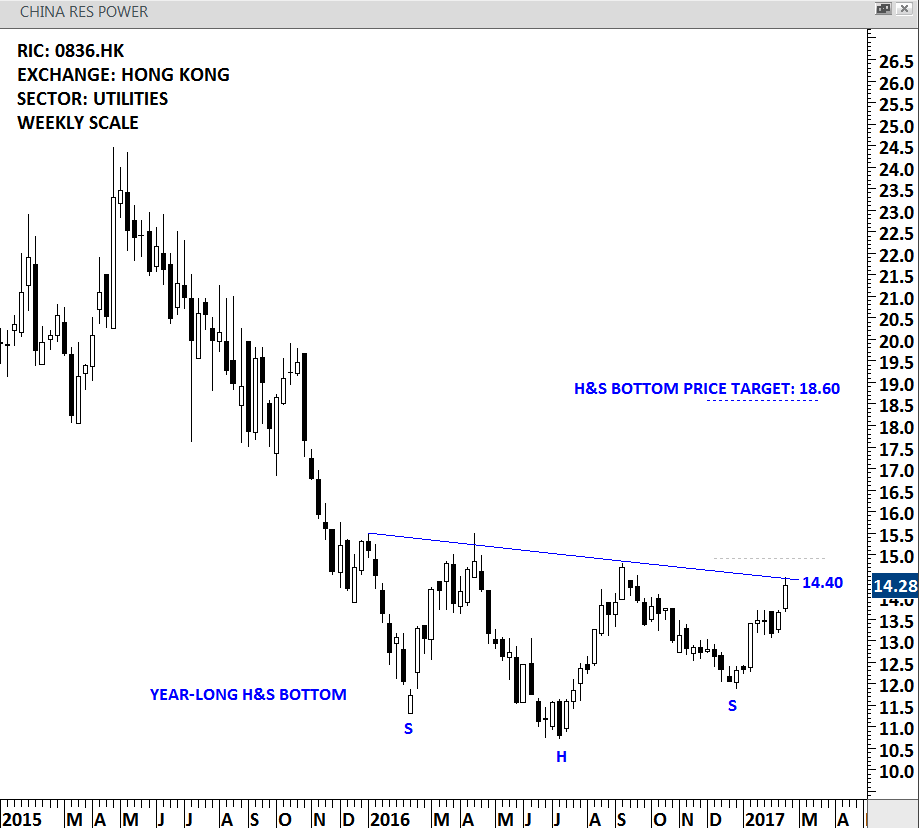
CHINA RESOURCES POWER HOLDINGS CO. (0836.HK [13])
China Resources Power Holdings Company Limited is a Hong Kong-based investment holding company principally engaged in the investment, development and operation of power plants. It is listed on the Hong Kong Stock Exchange. Price chart of China Resources formed a year-long H&S bottom chart pattern with a downward sloping neckline. The resistance stands at 14.40 levels. A daily close above 14.90 will confirm the breakout from the year-long base formation with a possible price target of 18.60.
 [14]
[14]CHINA RES POWER – WEEKLY SCALE
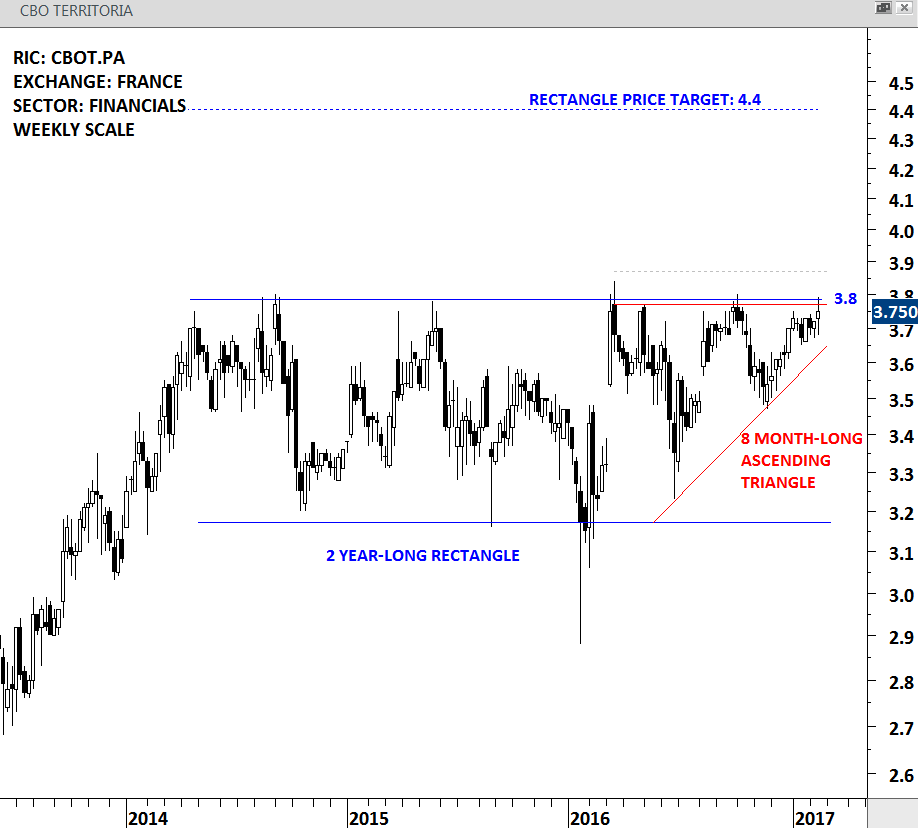
CBO TERRITORIA SA (CBOT.PA [15])
CBO Territoria SA is a France-based company primarily engaged in real estate, construction and development, as well as business and residential property management. It is listed on Paris Stock Exchange. Before we look at the chart development it is important to mention that this is a small-cap stock with limited liquidity. Price chart formed a multi-year rectangle between 3.2 and 3.8 levels. Over the past 3 years the upper boundary of the lengthy consolidation was tested for 9 times. Price chart also formed an 8 month-long ascending triangle with bullish interpretation. Given the overlap of the two major chart patterns, a breakout above 3.8 levels can be significant. A daily close above 3.87 will confirm the breakout from both chart patterns and suggest a price target of 4.4 levels.
 [16]
[16]CBO TERRITORIA – WEEKLY SCALE
SANLAM (SLMJ.J [17])
SANLAM LIMITED is a South Africa-based holding company. The Company provides solutions, which include life insurance; general insurance; investment management (including retail savings, asset management and wealth management); credit and structuring, and administration, health and other (such as estate planning, trusts, wills, and lending and health management). Price chart formed a 9 month-long symmetrical triangle with the upper boundary standing at 6,900 levels. This week was the 4th test of the upper boundary. A daily close above 7,100 levels will confirm the breakout with a possible price target of 8,400.
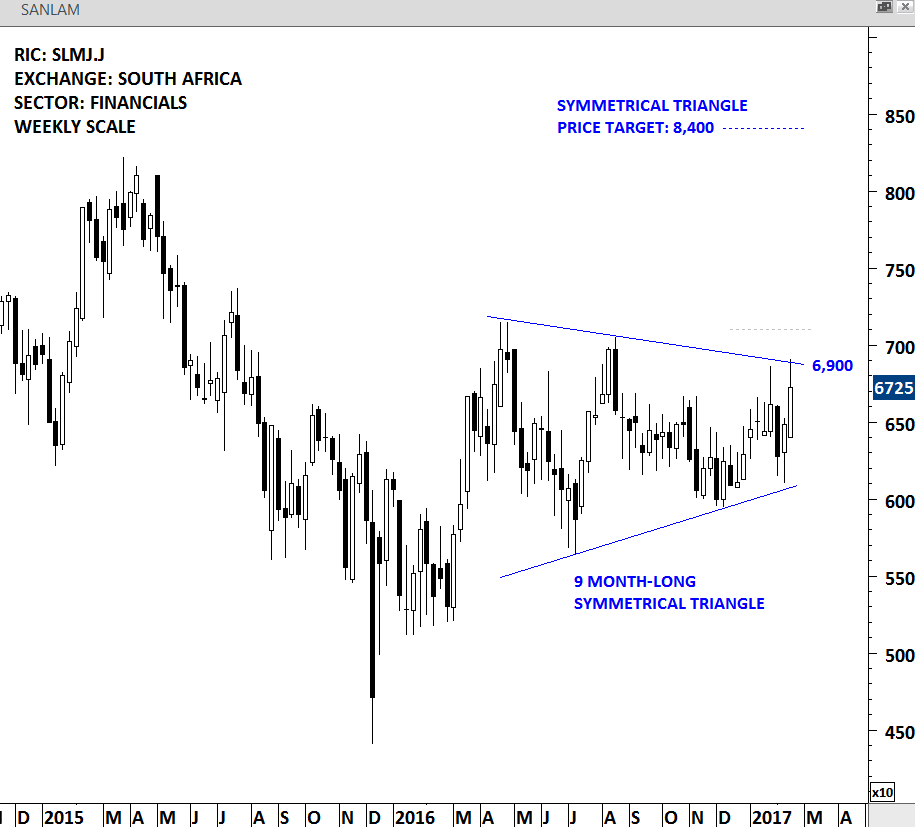 [18]
[18]SANLAM – WEEKLY SCALE
#TECHCHARTSALERT [19]
BANK OF CHINA (3988.HK [20])
Strong price action in the financial sector in Hong Kong/China helped BANK OF CHINA clear the resistance at 3.8 levels. A new chart pattern breakout signal is triggered with the daily close above 3.88 levels. While the weekly close was off the highest level recorded during the week, this was still a strong close on a weekly basis. Chart pattern price target stands at 4.65 levels.
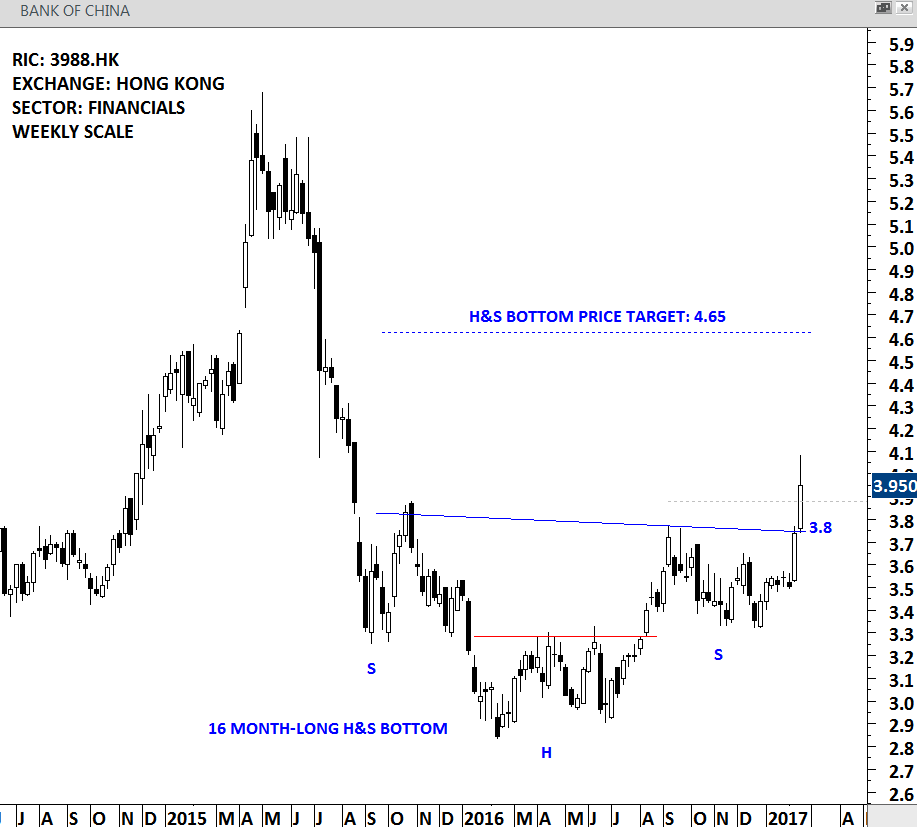 [21]
[21]BANK OF CHINA – WEEKLY SCALE
CHINA MERCHANTS CHINA DIRECT INVESTMENTS LTD (0133.HK [22])
China Merchants China Direct Investments Limited is a Hong Kong-based investment holding company principally engaged in financial investment. Price chart of CHINA MERCHANTS formed a 9 month-long bullish ascending triangle with the horizontal resistance standing at 12.05 levels. This week’s price action cleared the strong horizontal resistance and generated a new chart pattern breakout signal. Ascending triangle price target stands at 14 levels.
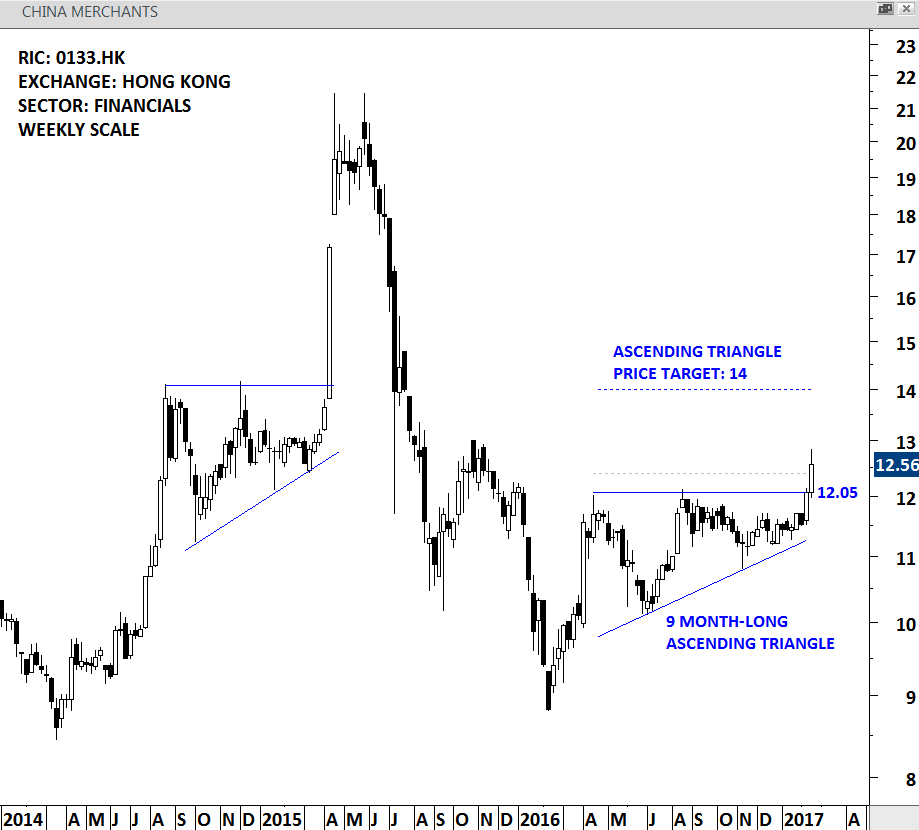 [23]
[23]CHINA MERCHANTS – WEEKLY SCALE
SPDR S&P BIOTECH ETF (XBI [24])
The Fund seeks to replicate as closely as possible the performance of an index derived from the biotechnology segment of a U.S. total market composite index. The Fund uses a passive management strategy designed to track the total return performance of the S&P Biotechnology Select Industry Index. SPDR S&P BIOTECH ETF is listed on the NYSE. Price chart formed a 4 month-long symmetrical triangle with the upper boundary at 66 levels acting as resistance. A new chart pattern breakout signal is generated after a daily close above 67.35 followed by a strong weekly close. Possible price target stands at 80 levels.
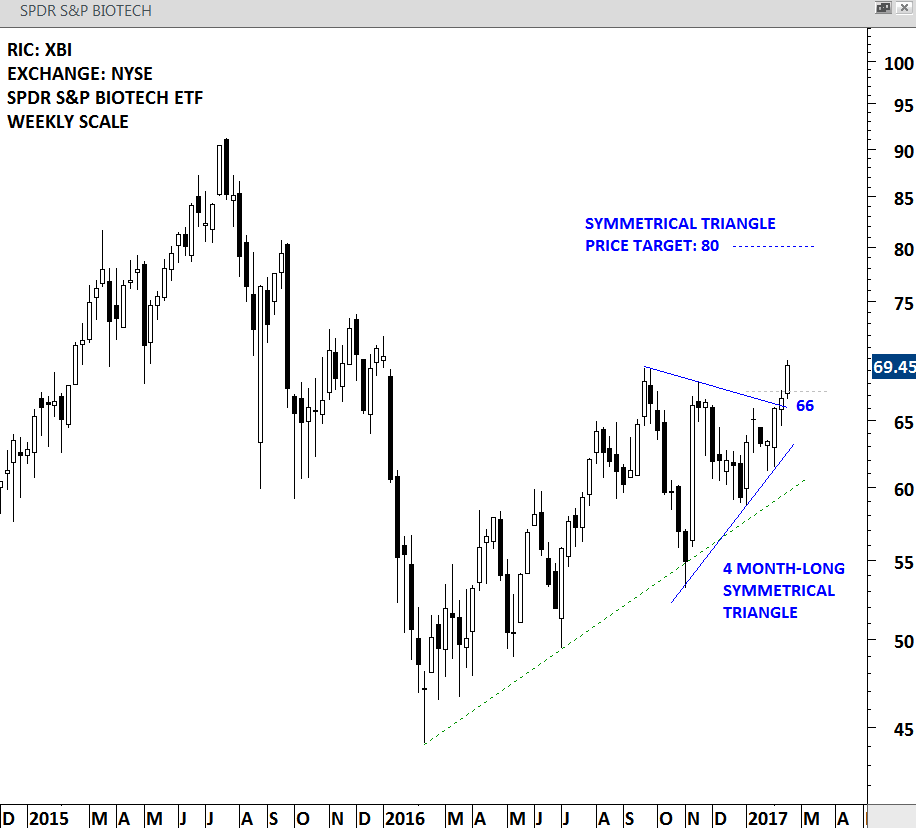 [25]
[25]SPDR S&P BIOTECH ETF – WEEKLY SCALE