After reviewing the charts I posted two weeks ago on Euro Stoxx 600 and MSCI ALL COUNTRIES WORLD INDEX [1], I can conclude that since then there has been more technical damage on global equity indices. Until markets recover above previously broken support levels, we should watch out for further downside in the global equity markets. In other words I’ll treat the current market conditions as a bear market.
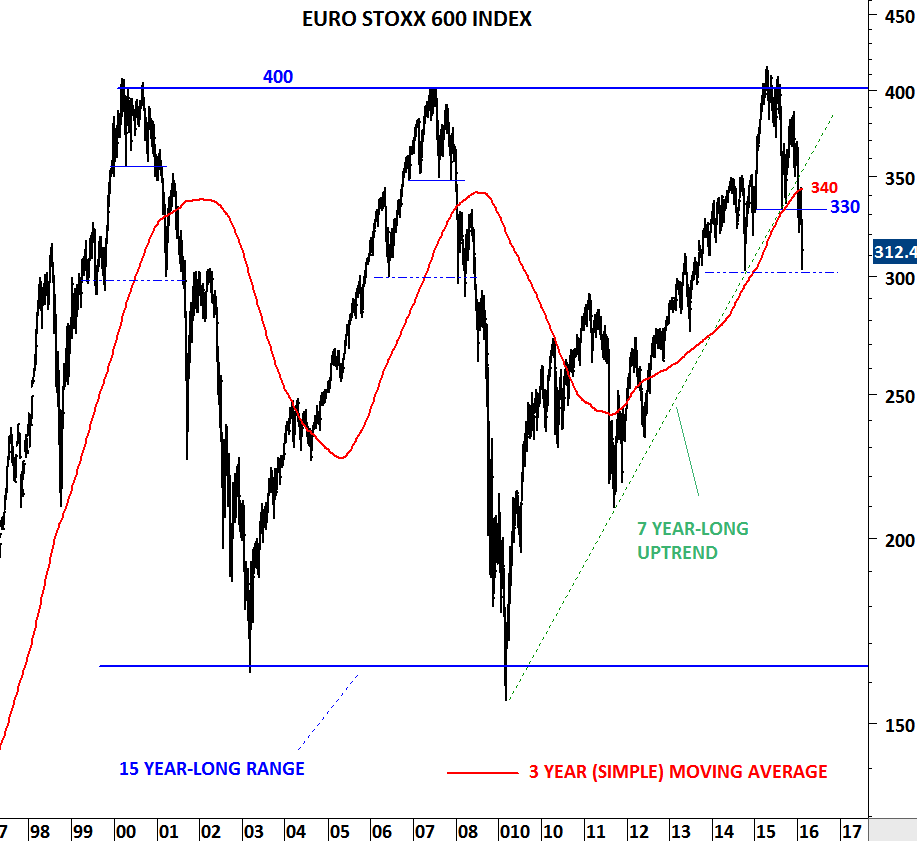
Markets seldom move in straight lines. Earlier price action on Euro Stoxx 600 shows how two different bear markets unfolded in 2001 and 2008. 330-340 area will remain as strong resistance. Both the 7 year-long uptrend and the long-term moving average are breached on the downside. Rebounds should be considered as bear market rallies.
 [2]
[2]Monthly price chart of EURO STOXX 600 INDEX
 [3]
[3]Weekly price chart of EURO STOXX 600 INDEX
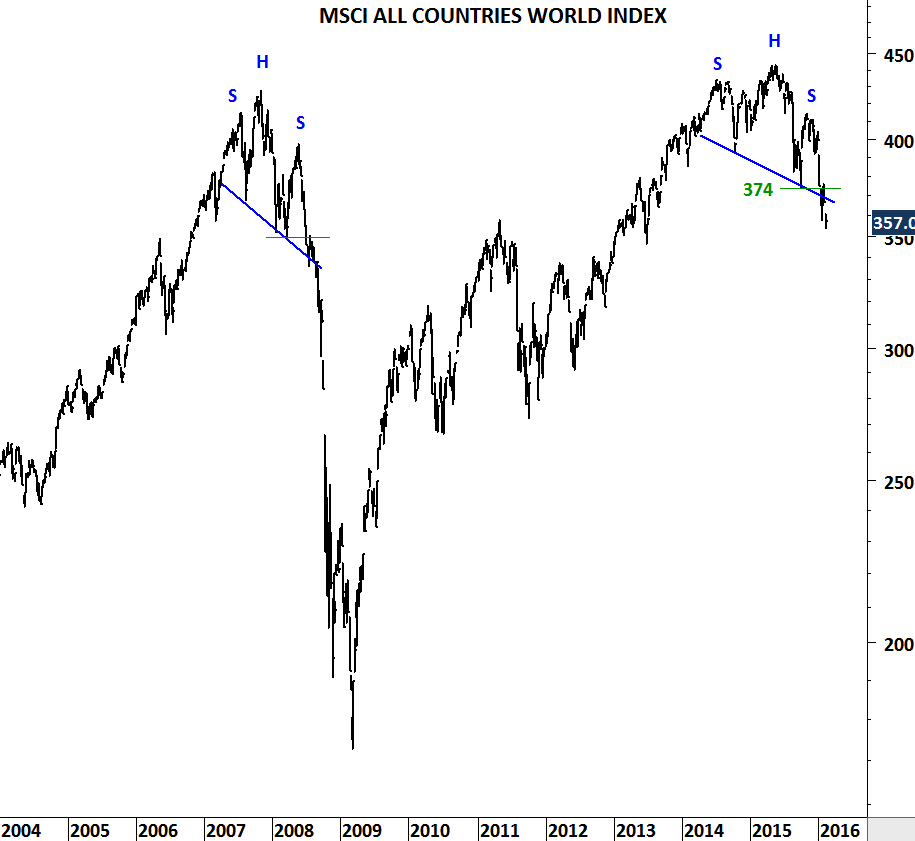
It clearly takes more effort to change the direction of the trend on MSCI ALL COUNTRIES WORLD INDEX when the global equity benchmark includes 23 developed and 23 emerging market equity index performance. So far it has given us a bearish message. 374-400 area will remain as strong long-term resistance. Failure to recover above 374 levels will resume the downtrend.
 [4]
[4]Monthly price chart of MSCI ALL COUNTRIES WORLD INDEX
 [5]
[5]Weekly price chart of MSCI ALL COUNTRIES WORLD INDEX
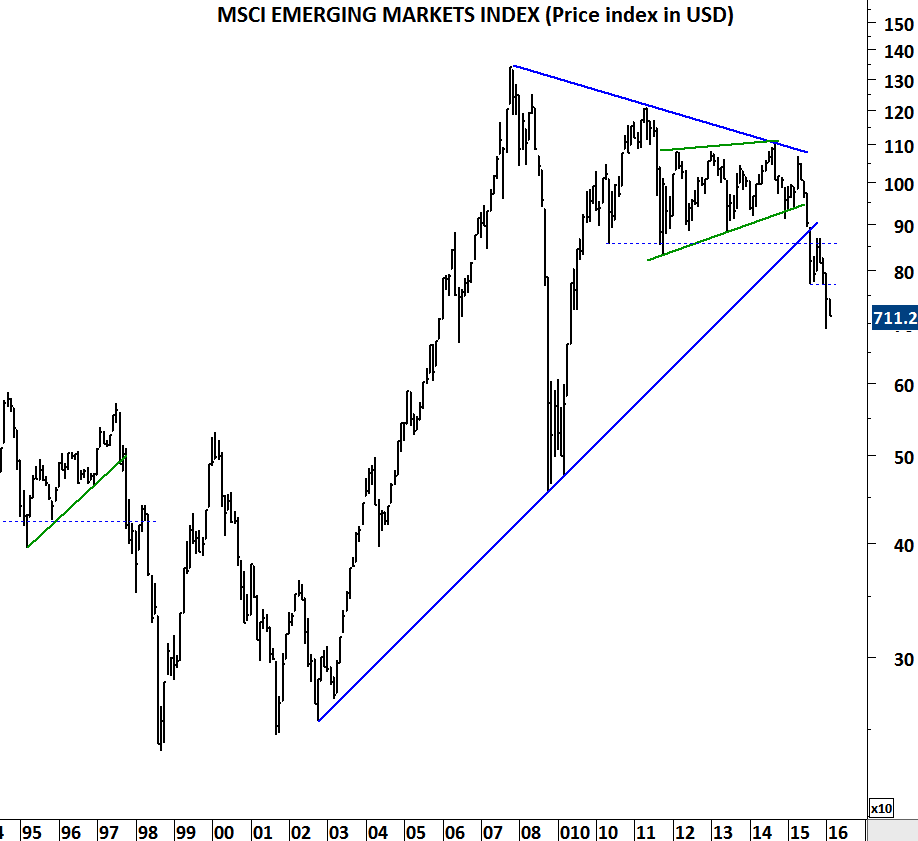
MSCI Emerging markets index is in a clear downtrend. The downtrend can accelerate. Index broke down decade-long trend line support and also the 5 year-long horizontal support at 850 levels. It is usually difficult to reverse momentum after such significant breakdowns.
 [6]
[6]Monthly price chart of MSCI EMERGING MARKETS INDEX
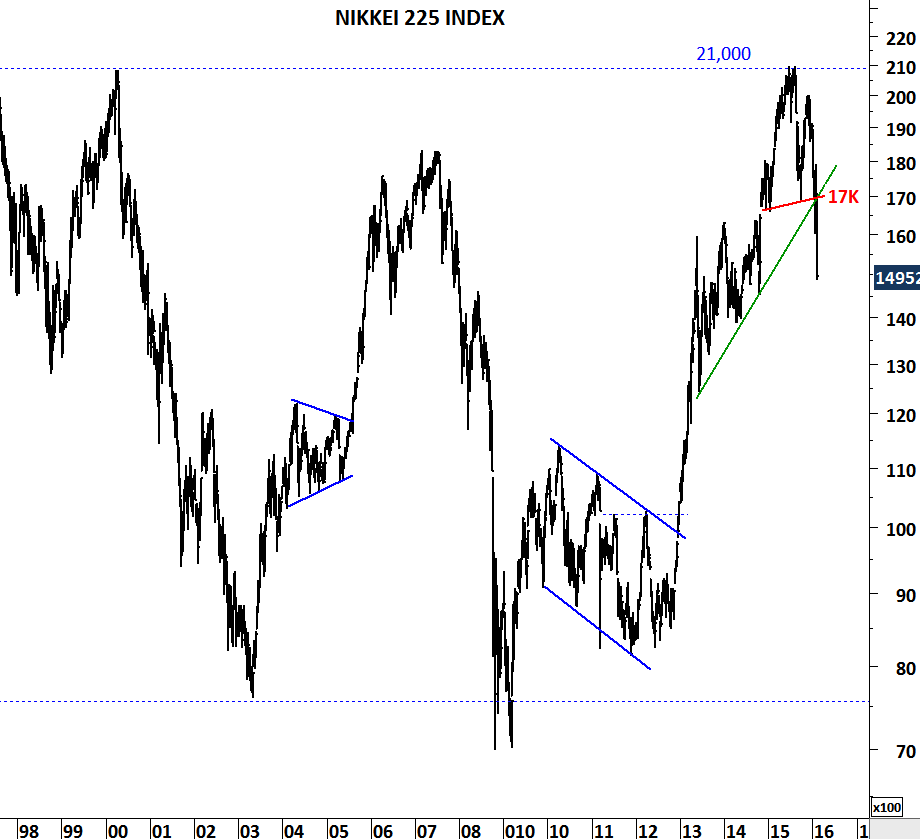
Sell-off in Japan has been sharp over the past few weeks. Two strong technical supports overlapping at 17,000 levels has been broken on the downside. While we can conclude that in the short-term the market is oversold, it will need a lot of effort for the market to reverse the negative sentiment and recover above 17,000 levels. This market is also suggesting weak performance for the coming months.
 [7]
[7]Weekly price chart of NIKKEI 225 index