There are discussions right now if last few week’s sell-off was another failed breakdown. Was this another bear trap? Did Central Banks again manage to put a floor to equity markets? ECB’s dovish comments and BOJ’s negative interest rate moves both came this month, after sharp sell-off in equity markets.
Due to developing bearish chart patterns and the fact that major indices are below their long-term averages I’m weighing the possibility of a correction more than a strong bull market in the coming months. This time could be different and the technical outlook might prove to be a bear trap. I’m fine with that. That’s what markets are. Current chart set-up is something that I can’t ignore and I’ll try to explain here.
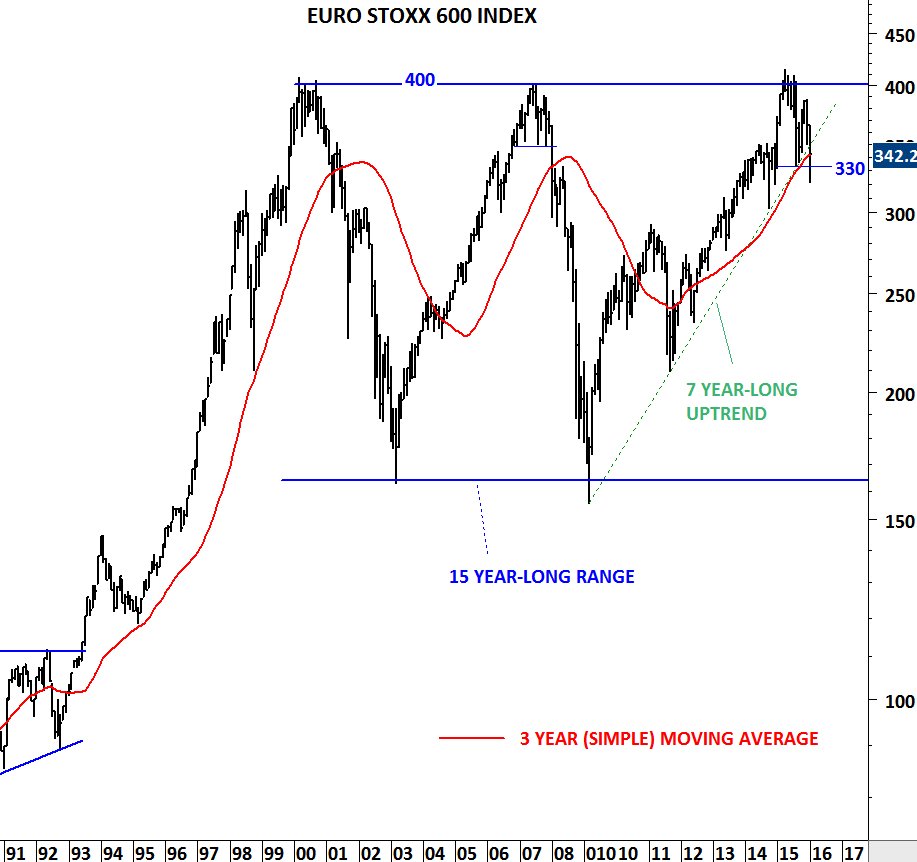
First let’s look at two major equity indices that we have been following. On a monthly scale “close” was at the border. The jury is still out in my opinion. Though, I would say last week of the month we have seen a good attempt to close at the higher levels for the month.
 [1]
[1]
 [2]
[2]
Richard W. Schabacker in his book TECHNICAL ANALYSIS AND STOCK MARKET PROFITS (Printed in US in1932) [3] discusses Important Reversal Formations. Under this section there is a detailed study of Head and Shoulder reversal chart patterns. We are all familiar with the Head and Shoulder chart pattern. I want to draw attention to a specific type that we are seeing right now on equity index charts. Schabacker explains:
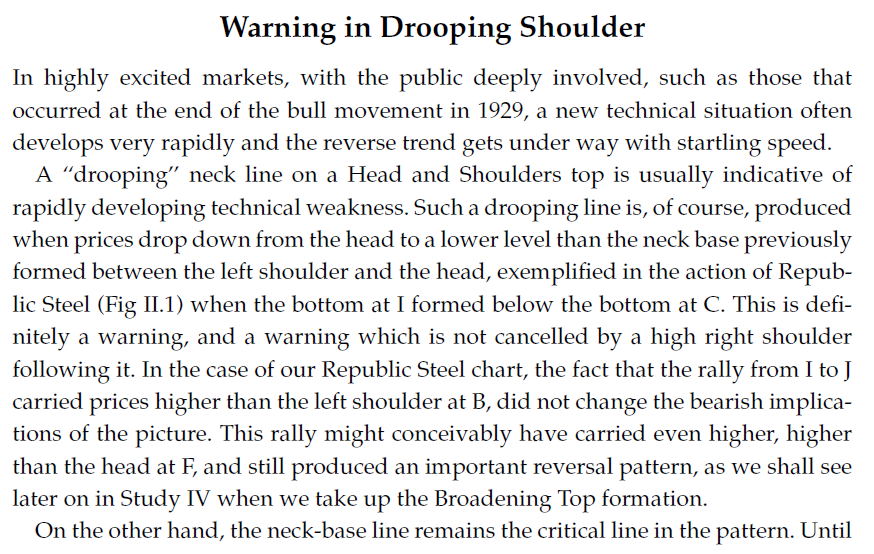 [4]
[4] [5]
[5]
Here is the chart he was analyzing at the time. Please note that the original chart doesn’t include the red trend line (neckline). I added this to show the similarities with the current chart patterns.
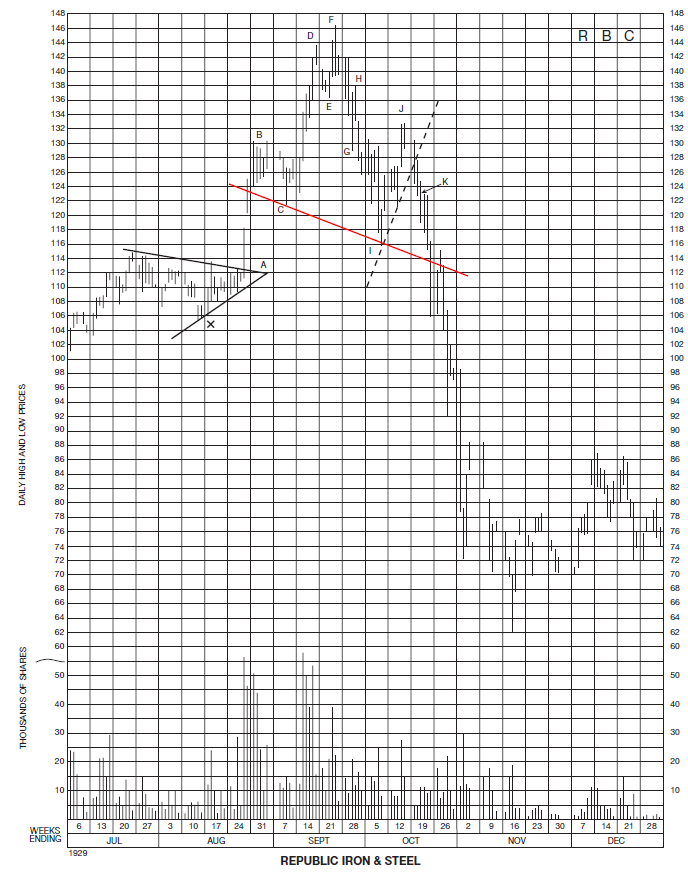 [6]
[6]
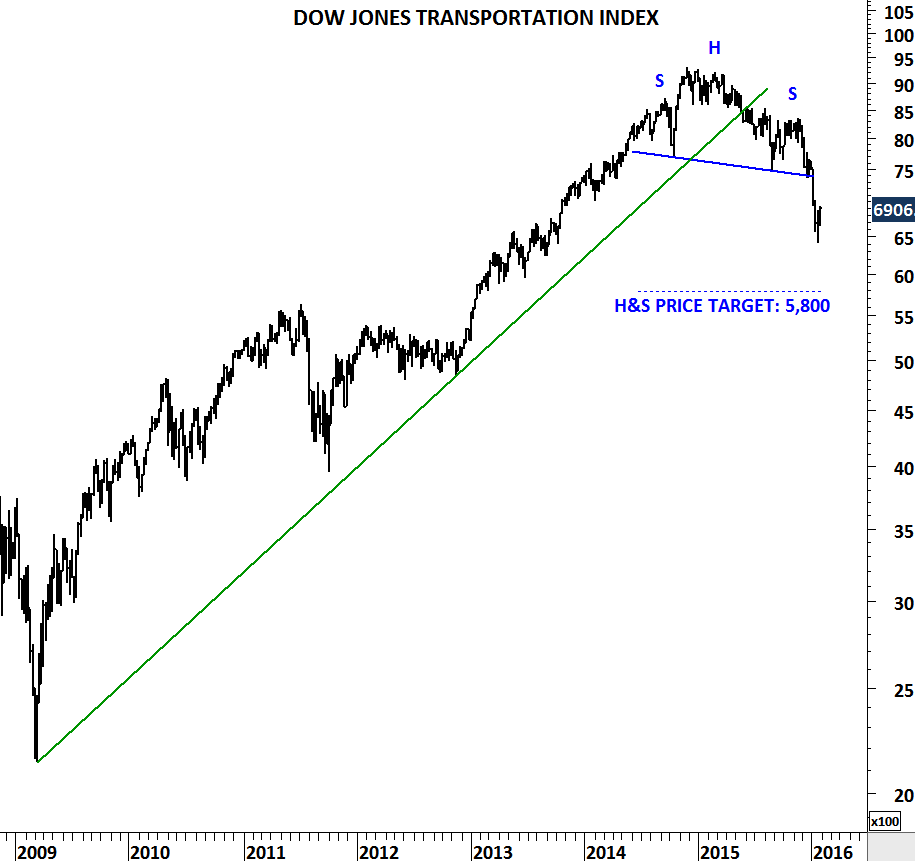
Several decades later similar chart patterns are appearing on the widely followed and traded equity indices. Dow Jones Transportation Index broke down a similar downward sloping trend line. Head and shoulder price target is at 5,800 levels, still far from current 6,906 levels.
 [7]
[7]
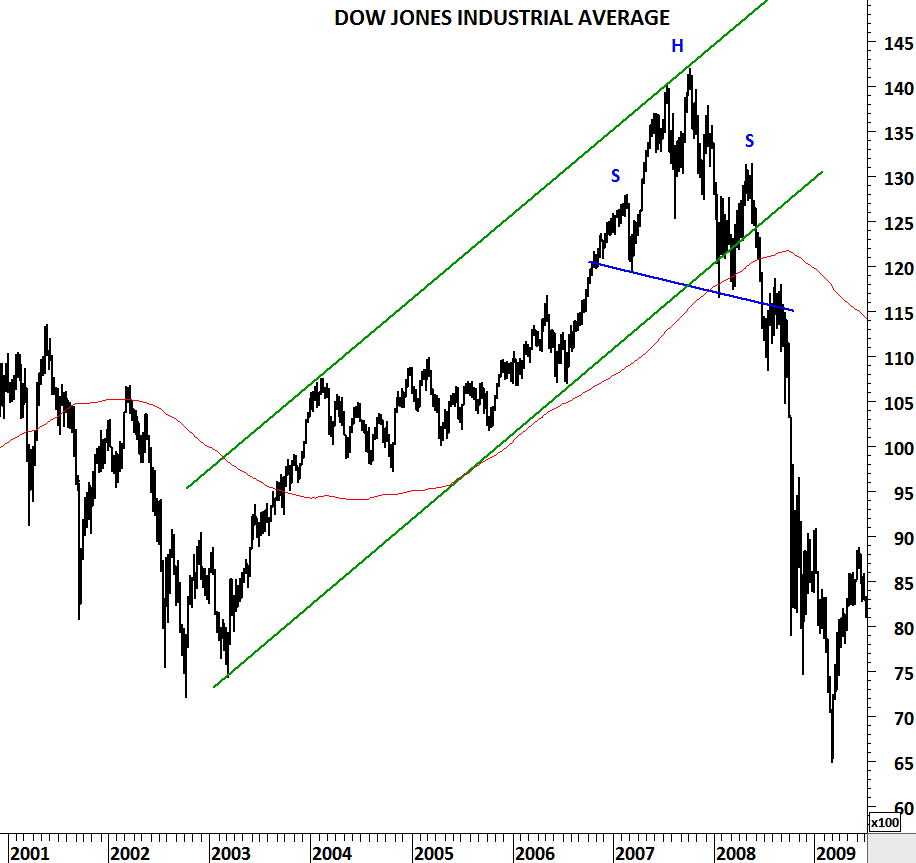
Now let’s look at some similarities between 2008 and 2016. In 2008, Dow Jones Industrial Average reversed its 4 year-long uptrend with a Head & Shoulder top. Neckline was downward slanting. After the breakdown there was a pullback that violated the neckline but couldn’t push above the long-term average or inside the trend channel. The head and shoulder top that formed in 2007-2008 showed significant market weakness due to its drooping shoulder.
 [8]
[8]
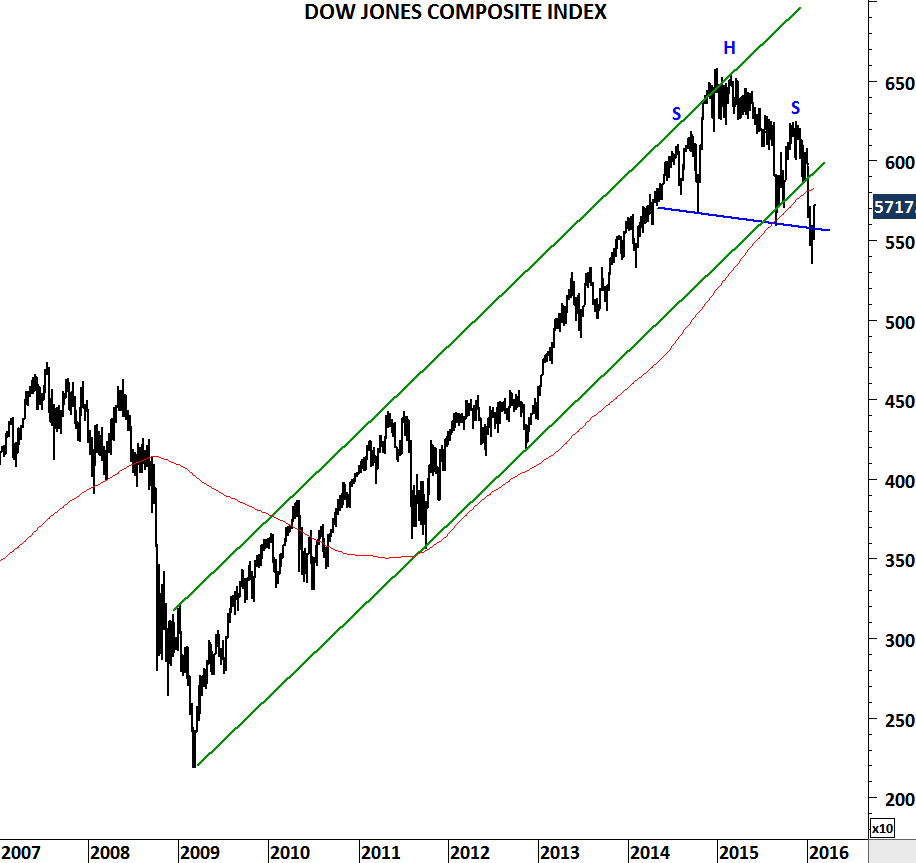
Dow Jones Composite Average is now forming a similar Head and Shoulder top with downward sloping neckline. Both the long-term moving average and the lower boundary of the 6 year-long trend channel is violated. If this time is not different, current chart set-up suggests a correction is more likely in the following months than the continuation of the bull market.
 [9]
[9]
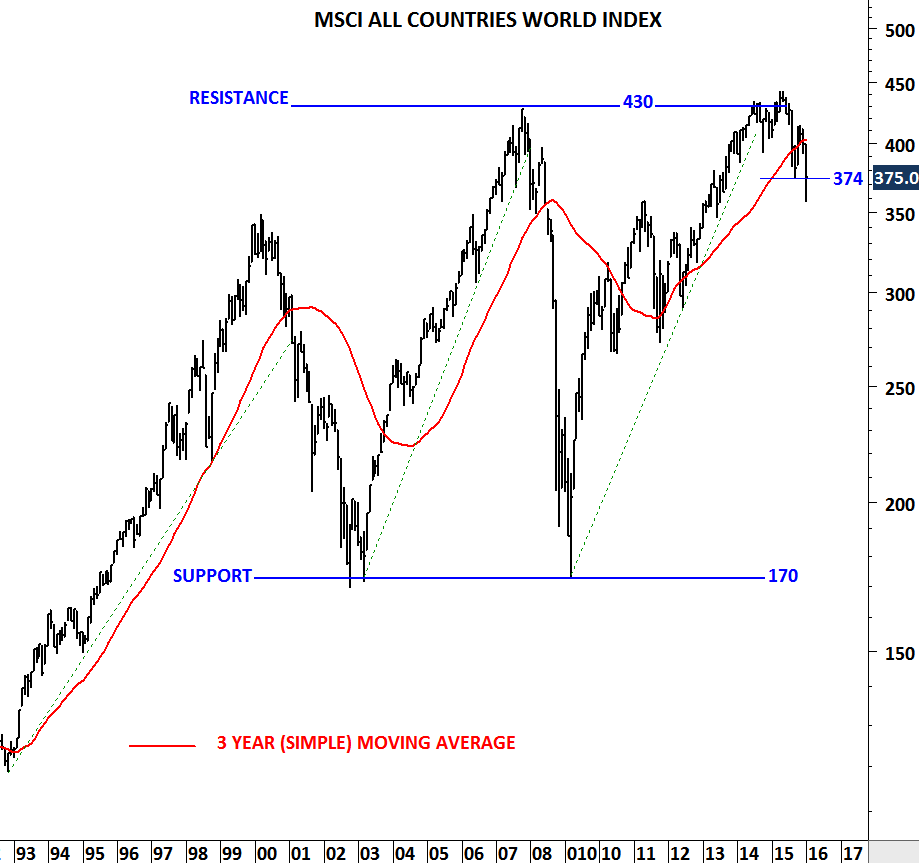
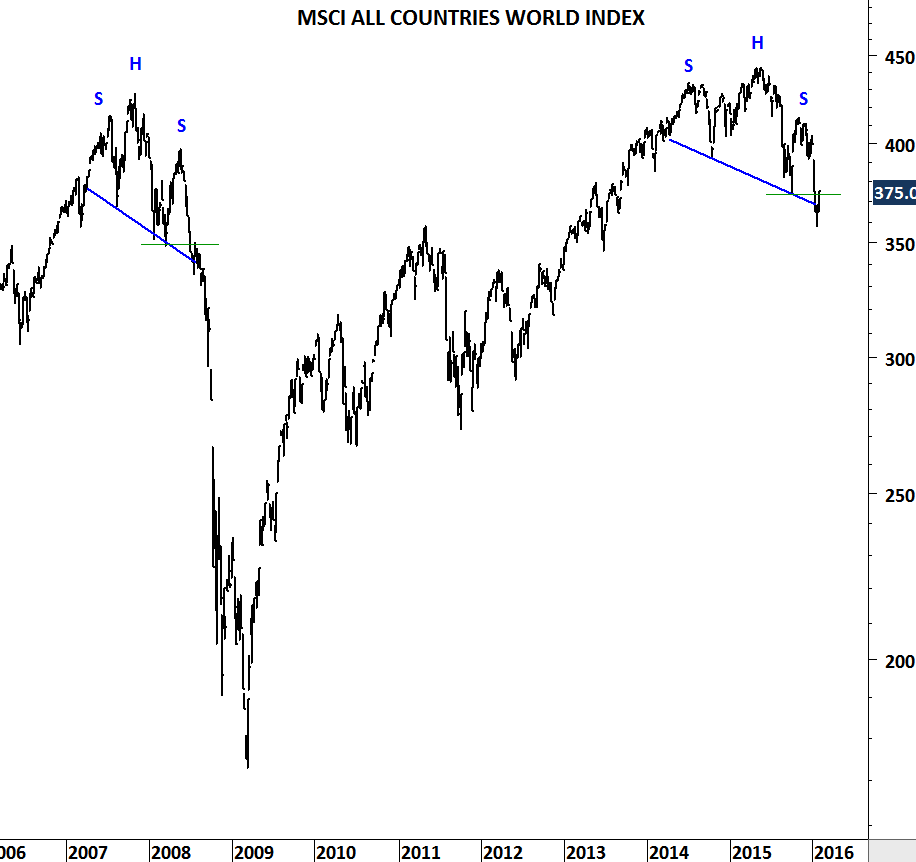
We can also look at MSCI ALL COUNTRIES WORLD INDEX and compare the top in 2007-2008 with the latest chart development. I think the current technical conditions can’t be ignored. I want to give these markets some more time to prove the bears wrong.
 [10]
[10]