Small caps show relative weakness vs. the large caps when investors move out of riskier/high-beta names and into relatively safe large caps. Opposite can be said during small cap strength vs. large caps.
There are two ways to capture this relationship to understand if there is a possibility of small cap outperformance in the following weeks.
1) Russell 2000 vs DJIA is now testing a 6 year-long trend line support. Until it is broken down, these type of trend lines are expected to resume the current trend. In this case the trend is upwards and the ratio is likely to rebound from the long-term support, resulting in an outperformance for the small caps.
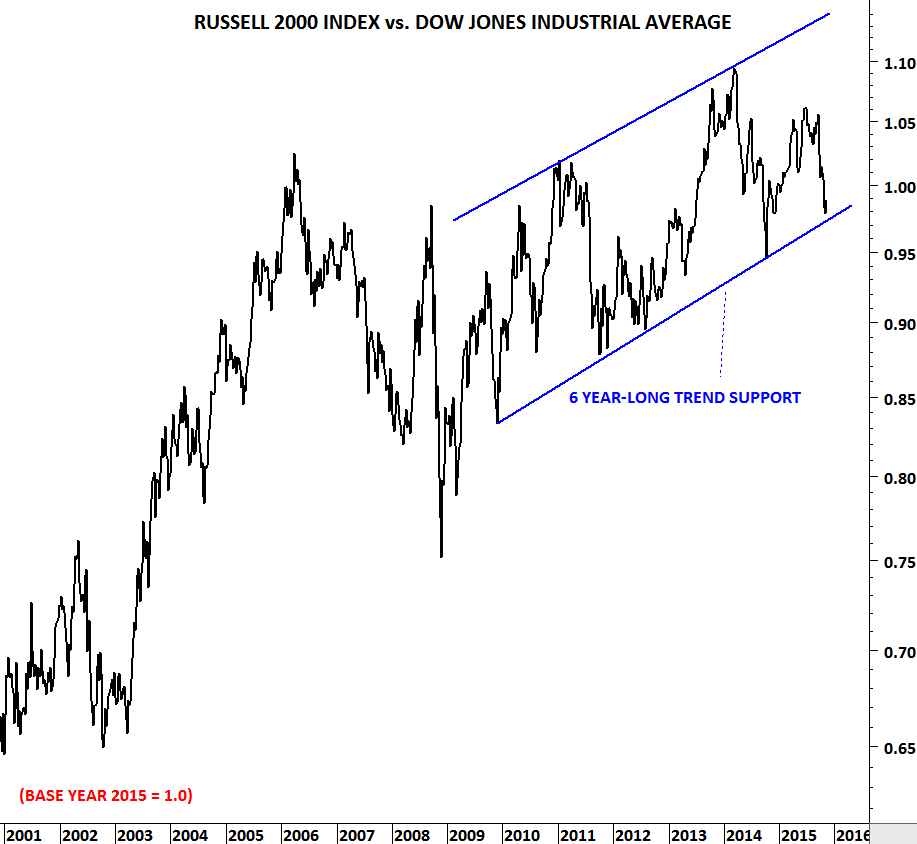
Data Source: Thomson Reuters, Charts created in MetaStock
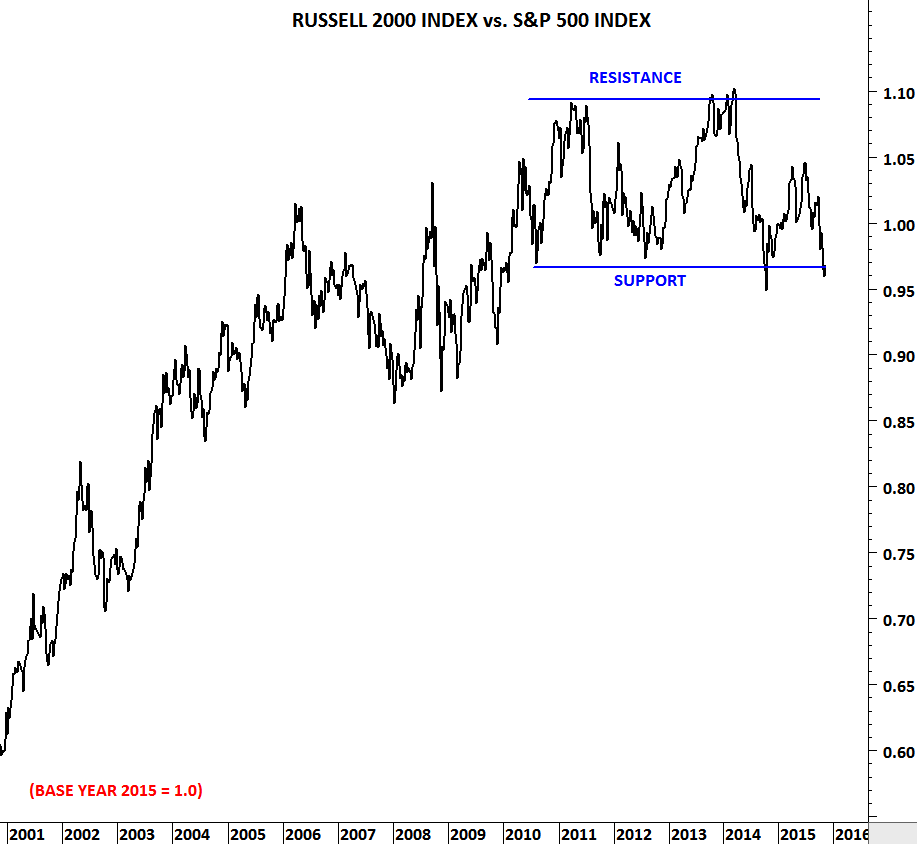
2) Russell 2000 vs. S&P 500 index is now testing the lower boundary of the horizontal trading range. A rebound from the lower boundary will likely result in an outperforming period for Russell 2000 index versus the S&P 500 index.
 [1]
[1]Data Source: Thomson Reuters, Charts created in MetaStock