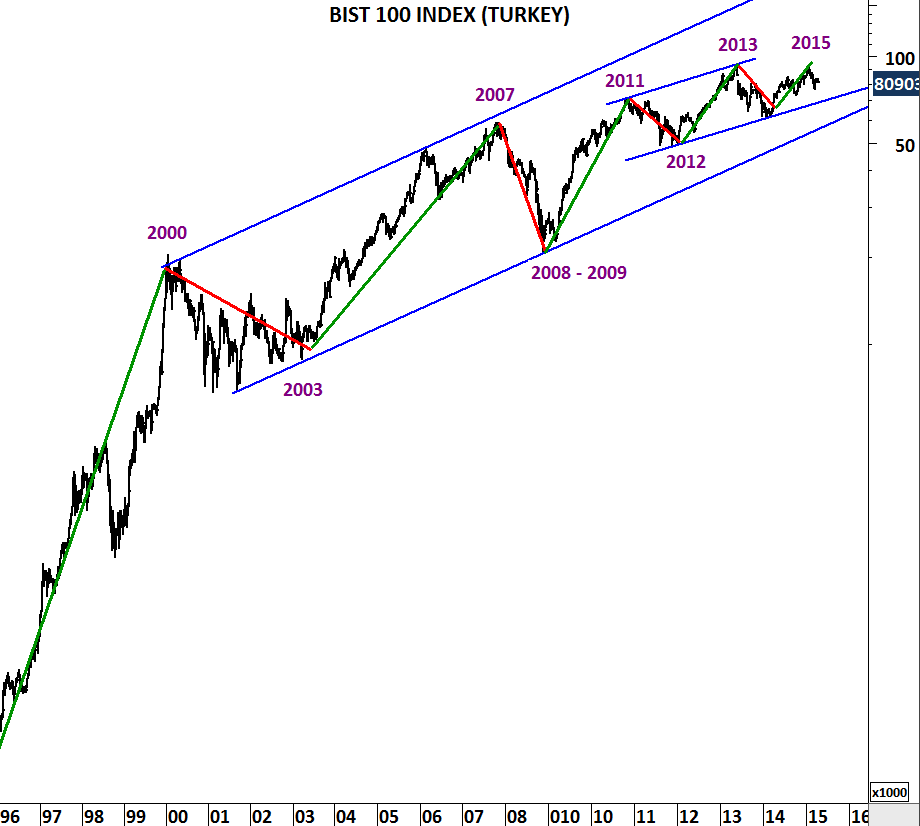
Industrial sector outperformance is usually negative for Turkey’s BIST 100 index. Last time I updated this chart was in January 2014 [1]. Since the last update It’s been more than a year and BIST 100 index trended higher from 60,000 levels to 91,000 levels. Strong upward trend might be reversing once again towards a corrective period in Turkish equities.
 [2]
[2]
 [3]
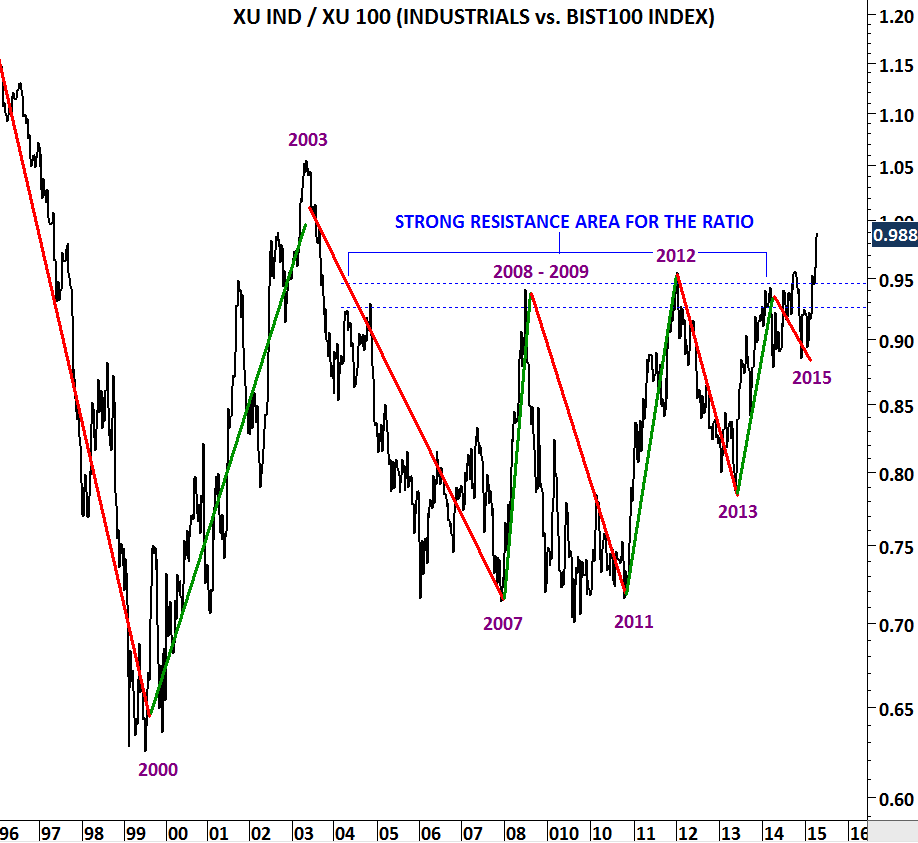
[3]Industrial Sector continues to outperform the BIST 100 index.
Relative performance ratio between Industrial sector and BIST 100 index is breaking out of a long-term consolidation. Historically industrial sector’s outperformance didn’t bode well for the BIST 100 performance. Strong uptrends were usually led by financial sector outperformance.
Latest change can have significant medium/long-term implications. We can expect further correction/sideways trading in equities and continuation of industrial sector outperformance in the coming months.