 [1]
[1]
Parabolic moves are not sustainable. They are also not easy to trade. It is costly to pick a top or a bottom. Price usually doesn’t stop where we think it would stop. However as a chartist I feel the urge to bring such imbalances to your attention. Whatever the instrument, these type of price movements are the perfect case studies to examine crowd psychology. USD/RUB entered into a parabolic move after breaking above 36.50 – historical high level. Sharp reversals are experienced after such steep price actions. In the past, similar price movements took place on few other charts.
 [2]
[2]
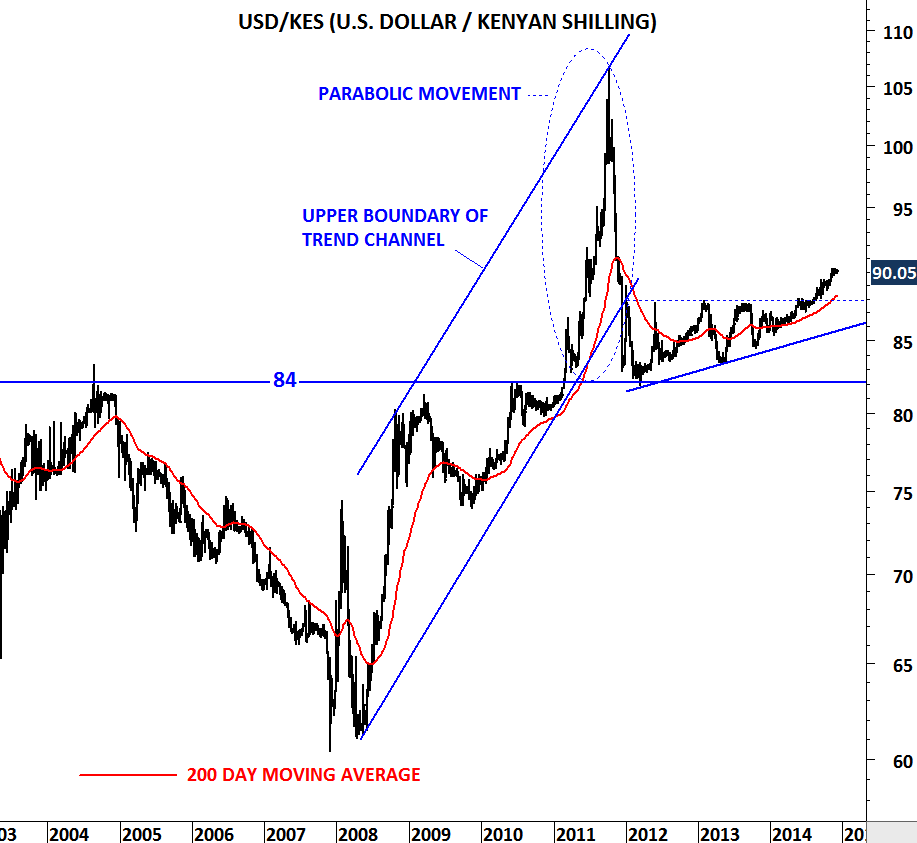
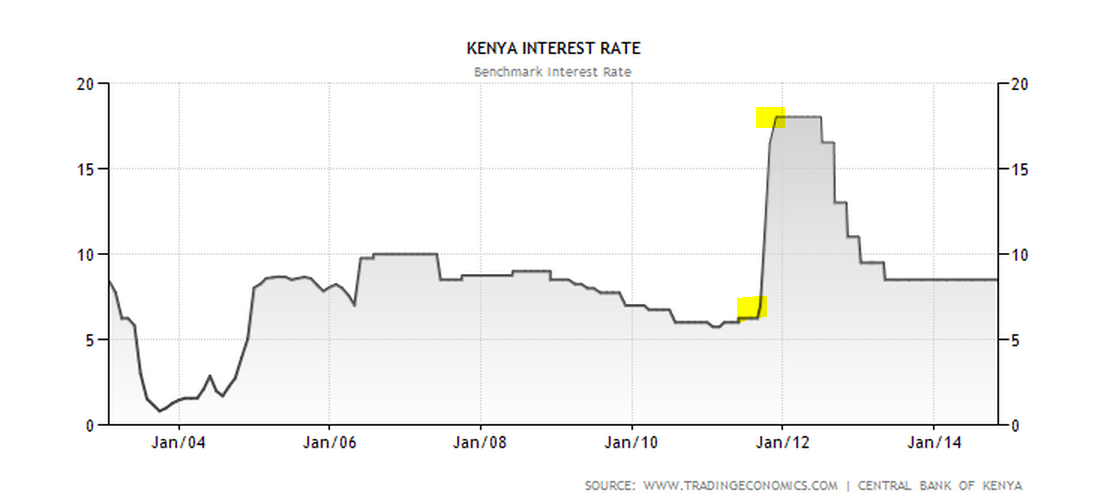
In 2011, USD/KES (U.S. DOLLAR/KENYAN SHILLING) had a similar long-term breakout followed by a 8 month-long parabolic move. Steep price action was reversed by Central Bank of Kenya’s bold action to raise interest rates from 6 percent to 18 percent in less than a year.
 [3]
[3]
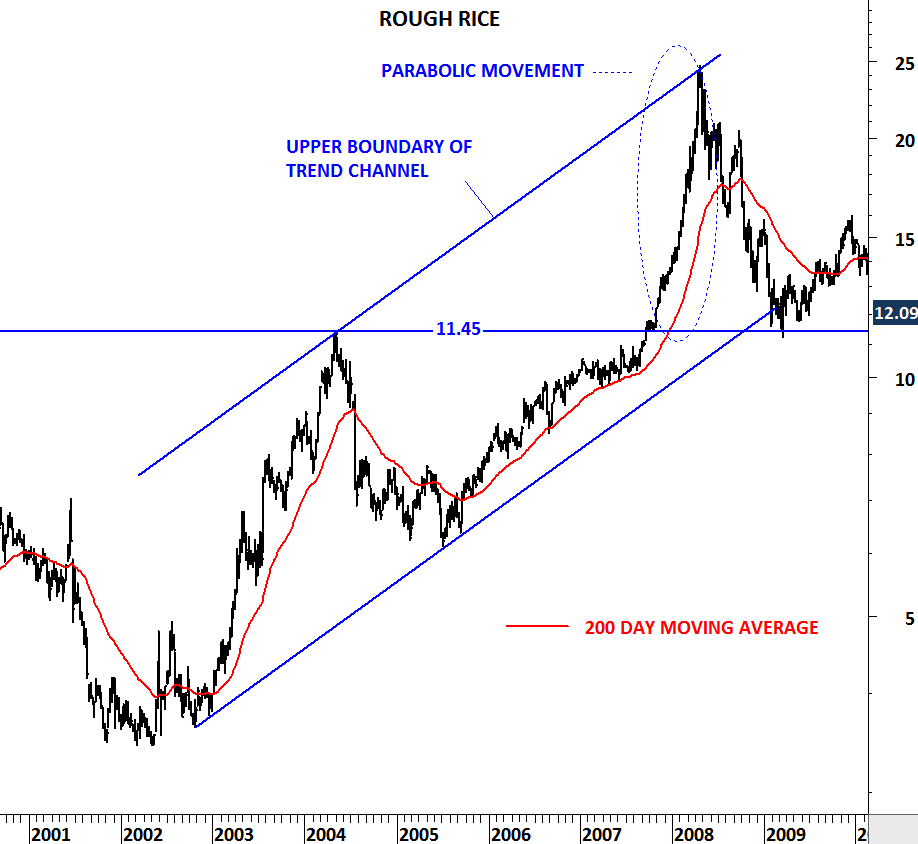
In 2008, Rough Rice price rallied from 11.45 to 25 levels. Rice made the headlines (news on Rough Rice [4]). Hoarding and export bans were the result of the sharp price increase. Rough rice fell back to 11.45 levels in the following year.
 [5]
[5]