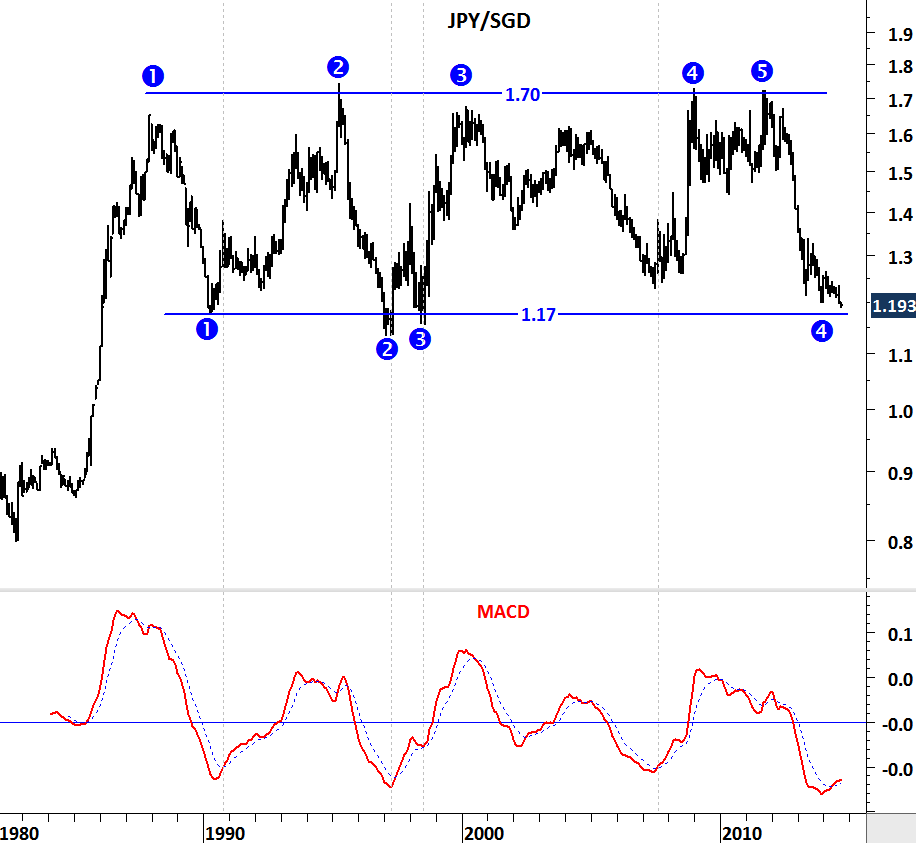
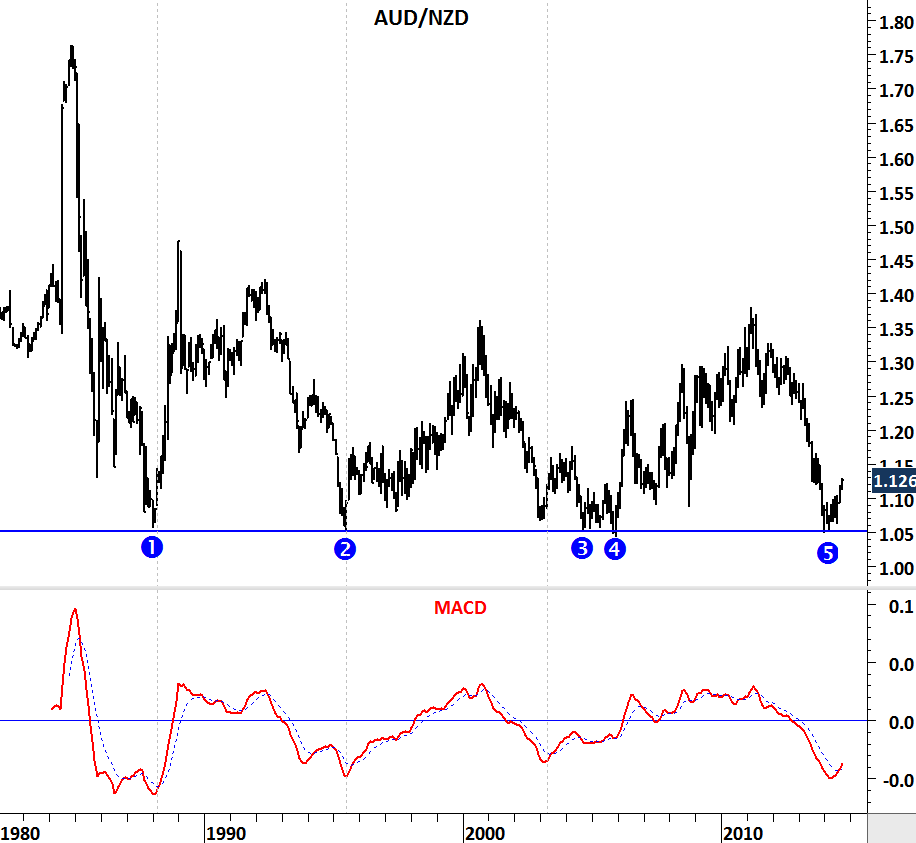
Long-term opportunities don’t often come along. So when they do it’s worth paying attention to these developments. In the beginning of 2014, AUD/NZD cross-rate was finding support at a multi-decade horizontal trend line. Base formation took more than 5 months to develop. I sent out two updates one in (April 30,2014 [1]) and one in (June 4, 2014 [2]) drawing attention to a major low. Similar technical chart development is now presenting itself on the JPY/SGD. Cross-rate is reaching a multi-decade support area between 1.15-1.17. This could be a major low for the JPY/SGD. Though, it is important to note that base formation could take several months.
 [3]
[3]
 [4]
[4]