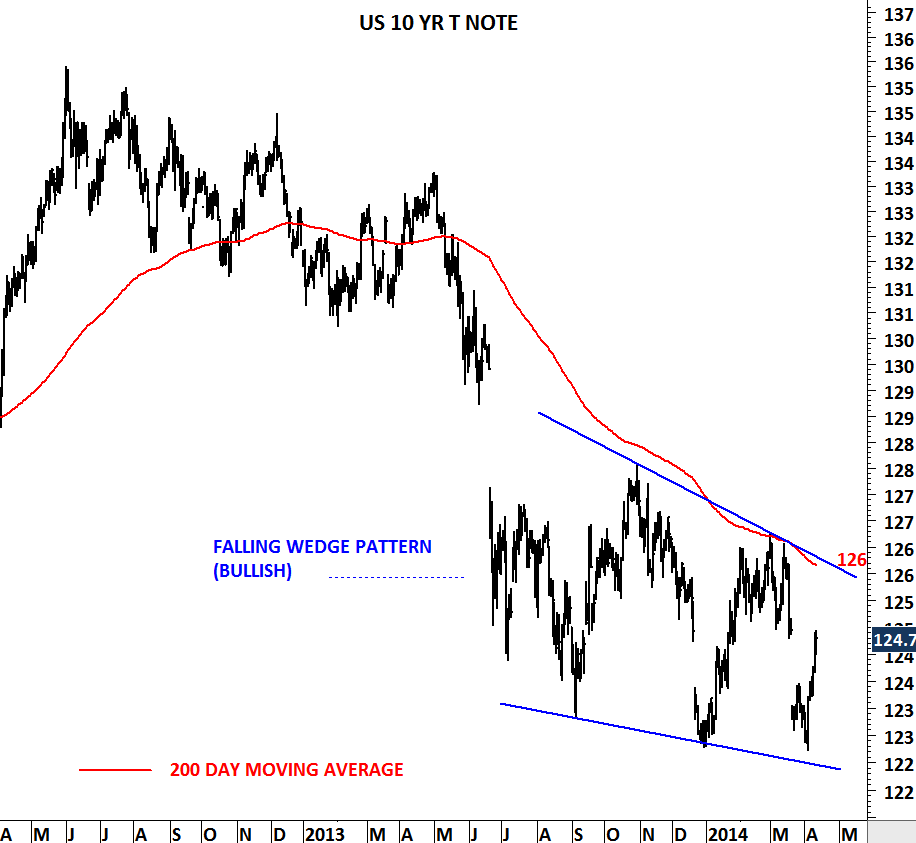
U.S. treasury and government bond prices are completing bullish chart patterns that could resolve on the upside in the following weeks. U.S. 30-year T Bond is completing an inverse head and shoulder [1] base and the U.S. 10 year T Note is forming a falling wedge [2] pattern. Both chart patterns are considered to be bullish and suggest higher prices in the short/medium-term. Breakout above 135.3 levels will confirm the inverted head and shoulder on the 30-year T Bond price chart and breakout above 126 levels will confirm the falling wedge on the 10-year T Note.
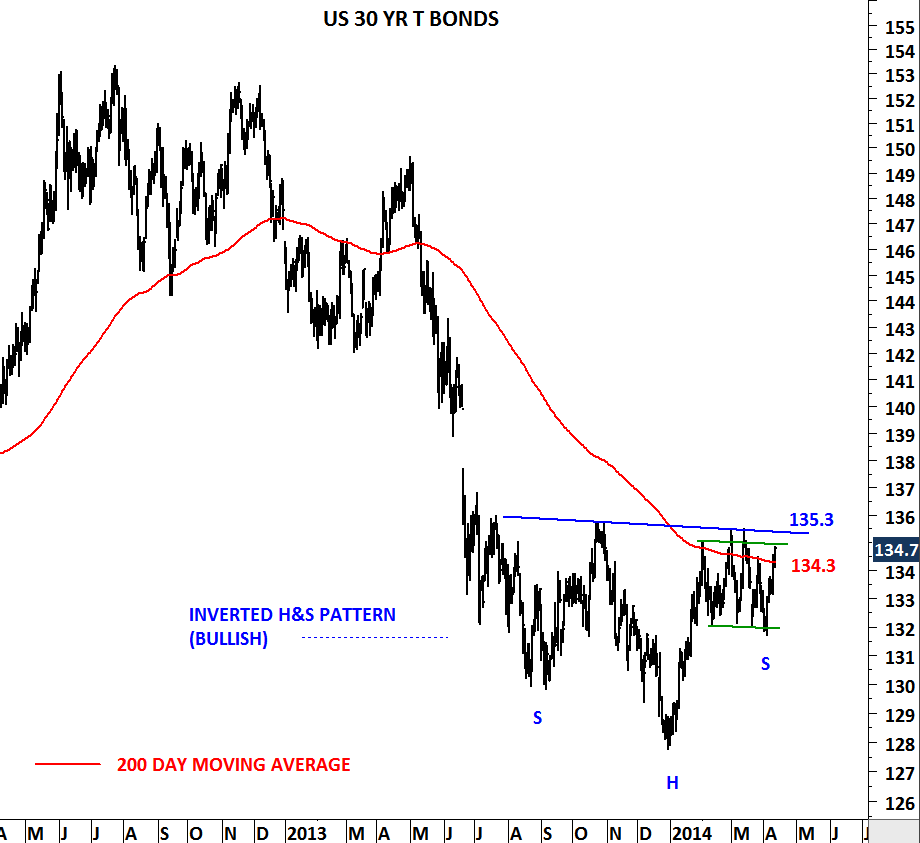 [3]
[3]
 [4]
[4]