Will the unemployment rate in U.S. decline towards 6% in the following years? Here is a quote from Warren Buffett: “The U.S. unemployment rate could fall to as low as 6% within a few years. In an interview on Bloomberg TV, Buffett said the U.S. will come back big time on employment when residential construction recovers. An unemployment rate of 6% is possible within a few years.”
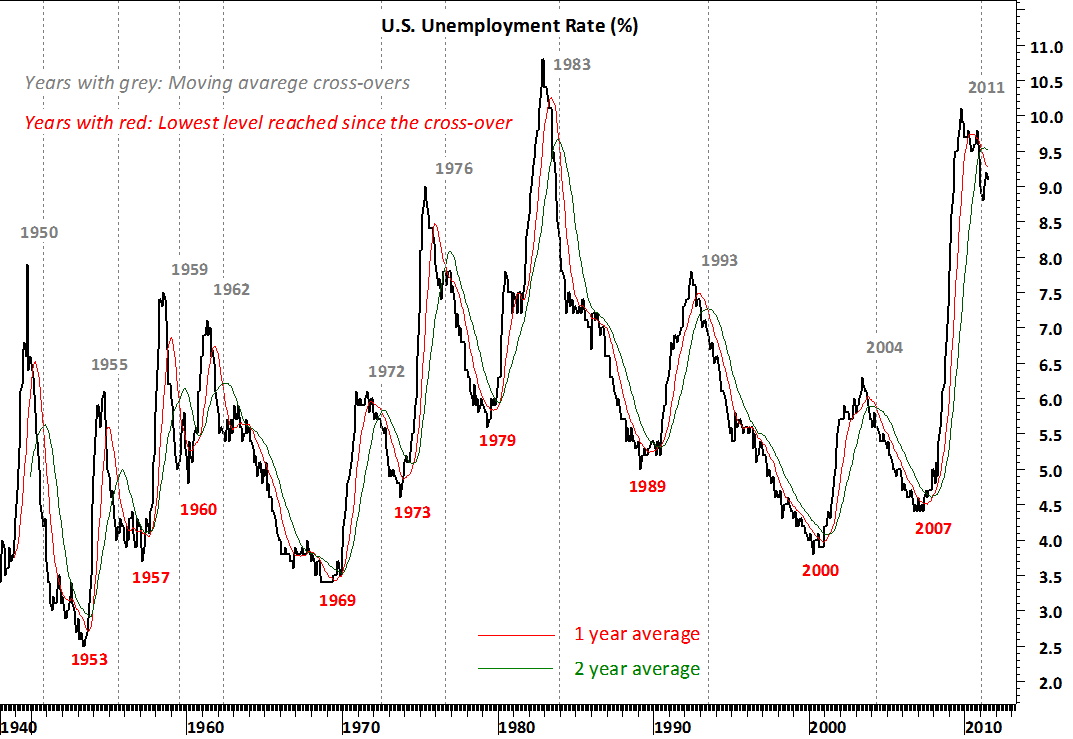
In this update I’m trying to understand and analyze the past behavior of the unemployment rate in the U.S. I’m using 1 & 2 year simple moving averages of the monthly data since 1948. The chart shows the years in grey color when moving averages crossed over (started a down trend in unemployment) and the years in red color when unemployment rate reached a low. Out of 9 cross-overs in the past six decade, 2 were short-lived and downtrend in unemployment rate reversed in the following year after the cross-over. These were during 1959-1960 and 1972-1973. After mild recoveries in the unemployment rate, economic outlook weakened and rate moved higher.
However, of the remaining 7 cross-overs in the past six decade, unemployment continued to decline for a minimum of 2 years and maximum of 7 years. Latest cross-over occurred in the beginning of 2011. If history is a guide in the worst case unemployment rate can continue lower for another year until 2012. In the best case we are headed towards 6% levels in the next 3-7 years.